Pemarkahan Impak Pelanggan: Cara Mengkuantifikasikan Kes Pelanggan untuk Keputusan Produk
Turn this article into takeaways for your work.
Each assistant summarizes the article only for you and suggests best practices for your work.
Ada item backlog yang telah berada di kedudukan 14 selama tiga suku tahun. Lapan belas akaun telah menandainya. Pasukan PM telah mengakuinya. Tiada siapa yang menggerakkannya.
Sementara itu, ciri yang diminta oleh dua akaun perusahaan dalam QBR bulan lalu kini ada dalam sprint. Seorang eksekutif menghadiri QBR tersebut. Pendapat orang bergaji tertinggi (HiPPO) menang lagi.
Begitulah cara backlog produk mati: bukan kerana kekurangan maklum balas pelanggan, tetapi kerana kekurangan sistem yang boleh diulang untuk menimbanginya. Tanpa model pemarkahan, setiap keputusan pengutamaan adalah rundingan. Hasilnya bergantung kepada siapa yang hadir, siapa yang bercakap paling kuat, dan siapa yang mempunyai leverage organisasi paling banyak.
Pemarkahan impak pelanggan adalah sistem yang menggantikan rundingan itu dengan nombor, bukan untuk menghapuskan pertimbangan PM, tetapi untuk memberikan pertimbangan sesuatu untuk berpaut kepada. Penyelidikan HBR tentang kesan HiPPO mendapati bahawa kuasa untuk keputusan strategik secara rutin beralih kepada pendapat orang bergaji tertinggi, dan bahawa organisasi memerlukan input data yang dikumpulkan secara awam atau dipacu data khusus untuk menangkis kecenderungan tersebut. Glosari penjajaran CS-product mentakrifkan istilah utama (bobot ARR, pekali risiko kadar peralihan, bendera akaun strategik) supaya CS dan product mengira perkara yang sama apabila menilai item backlog yang sama.
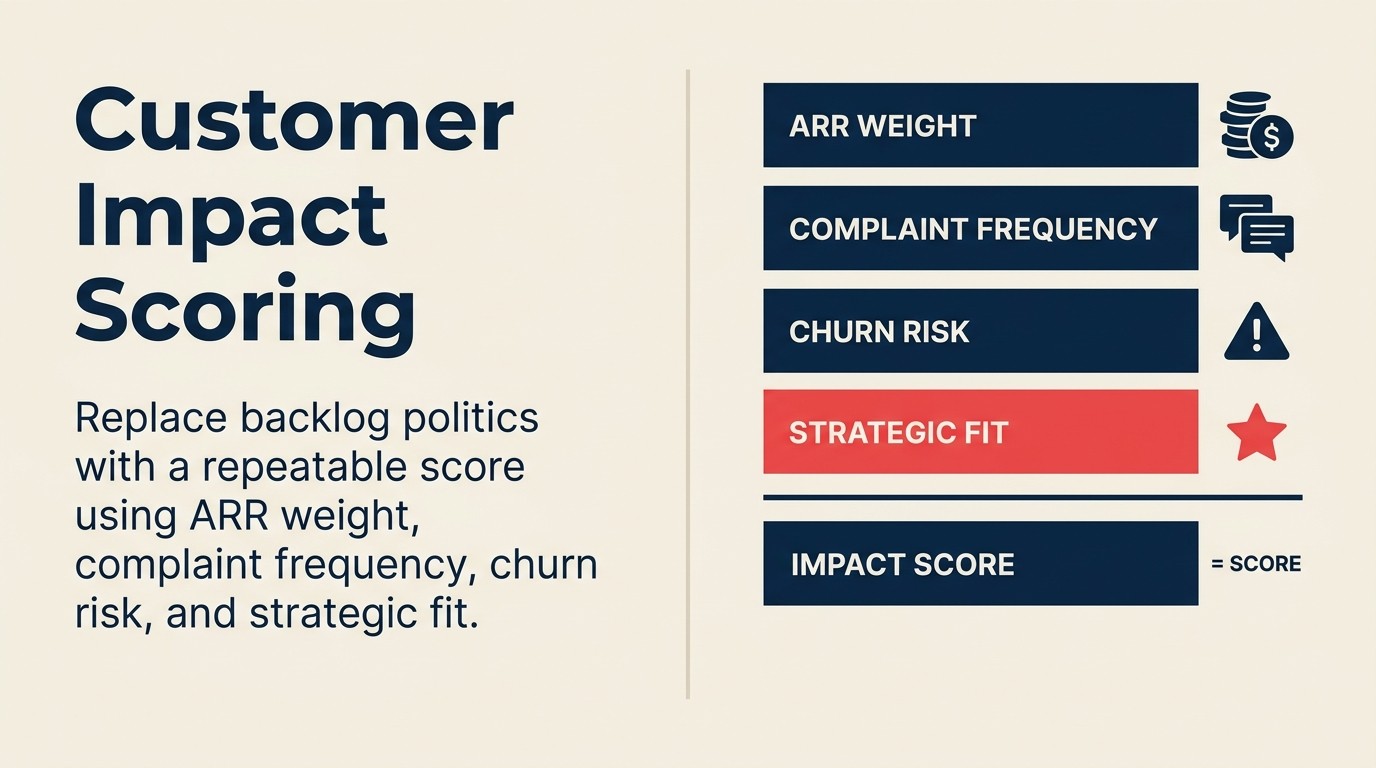
Skor Impak Pelanggan 4 Faktor mengoperasikan pengiraan itu menjadi nombor komposit dalam julat 0-100: ARR Terjejas (bobot 40%), Jumlah Akaun Ternormal (25%), Bobot Akaun Berisiko dengan pekali kadar peralihan 2.0 (20%), dan Bendera Akaun Strategik (15%). Bobot berjumlah 100 dan boleh dilaraskan mengikut keutamaan perniagaan. Alihkan bobot ke arah berisiko dalam suku tahun yang berfokus pengekalan, ke arah ARR dalam permainan pengembangan perusahaan. Dokumentasikan rasional apabila anda menetapkan bobot supaya model boleh diaudit setiap suku tahun.
Mengapa Kiraan Aduan Mentah Gagal
Sebelum membina model, adalah berguna untuk memahami mengapa alternatif paling biasa (mengira aduan) menghasilkan pengutamaan yang buruk. Penyelidikan pengutamaan keperluan di Wikipedia mendokumentasikan beberapa pendekatan pemarkahan berstruktur (termasuk model RICE: Capaian x Impak x Keyakinan bagi Usaha) dan pemarkahan berwajaran yang wujud tepat kerana kiraan undi mentah dan pangkat gerak hati menghasilkan hasil yang berat sebelah secara sistematik.
Berat sebelah jumlah: Ciri yang 50 pelanggan kecil mahukan mengatasi ciri yang 3 pelanggan perusahaan perlukan. Jika anda mengira mengikut jumlah akaun, anda membina untuk kuantiti akaun, bukan kualiti hasil. Permintaan ciri dari 50 akaun yang mewakili $250K ARR kalah kepada permintaan ciri dari 3 akaun yang mewakili $900K ARR dalam mana-mana model pemberian bobot yang rasional. Tetapi kiraan mentah tidak dapat melihat itu.
Berat sebelah roda berderit: Pelanggan yang lantang mendominasi saluran maklum balas. Pelanggan yang menulis permintaan ciri yang terperinci, hadir ke sesi penyelidikan pengguna, dan bertindak balas kepada setiap tinjauan NPS tidak mewakili asas pelanggan anda. Mereka adalah suku terlibat paling aktif. Pengguna yang senyap yang meninggalkan, mereka yang berhenti menggunakan ciri, tidak berkata apa-apa, dan membatalkan semasa pembaharuan, tidak pernah muncul dalam kiraan aduan.
Berat sebelah kebaruan: Apa yang timbul bulan ini diutamakan berbanding isu ekor panjang kronik yang telah dilaporkan selama lapan bulan. Isu ekor panjang mempunyai lebih banyak laporan jumlah. Tetapi ia dinormalkan ("itulah cara produk berfungsi") sementara aduan baharu terasa mendesak kerana ia baharu.
Model pemarkahan menangani ketiga-tiga mod kegagalan dengan menormalkan merentasi ARR, memberi bobot akaun berisiko secara berasingan dari akaun sihat, dan melihat kekerapan kumulatif berbanding kebaruan.
Fakta Utama: Mengapa Pengutamaan Produk Memerlukan Model Pemarkahan
- 74% pengurus produk melaporkan maklum balas pelanggan mempengaruhi roadmap mereka, tetapi hanya 31% mempunyai sistem formal untuk mengkuantifikasikan pengaruh tersebut. Selebihnya bergantung pada gambaran kualitatif dan pembelaan dalaman, menurut laporan State of Product Leadership Pendo.
- Ciri yang diutamakan menggunakan pemarkahan impak pelanggan yang berstruktur (menggabungkan bobot ARR, kekerapan, dan risiko kadar peralihan) mempunyai kadar penggunaan 40% lebih tinggi semasa pelancaran berbanding ciri yang diutamakan melalui proses tidak formal, menurut penyelidikan Productboard tentang syarikat yang dipacu produk.
- Pengutamaan yang dipacu HiPPO (pendapat orang bergaji tertinggi) mempengaruhi keputusan roadmap dalam 58% syarikat SaaS peringkat pertengahan pasaran, walaupun data maklum balas pelanggan tersedia. Jurang itu adalah ketiadaan model pemberian bobot yang berstruktur, menurut Product Management Institute.
Tiga Falsafah Pemarkahan
Sebelum membina komposit, fahami falsafah yang mencerminkan setiap komponen. Pasukan akan memperdebatkan mana satu yang "menang," dan jawapannya adalah tiada satu pun menang dalam pengasingan.
Pemarkahan berwajaran ARR mengutamakan berdasarkan impak hasil: jumlah ARR dari semua akaun yang menandai isu menentukan bobot skornya. Ini betul untuk melindungi hasil barisan atas dan untuk roadmap yang melayani strategi perusahaan dahulu. Ini salah sebagai satu-satunya input kerana ia secara sistematik merendah nilai akaun SMB walaupun SMB mewakili segmen pertumbuhan yang syarikat cuba kembangkan secara aktif. Pemarkahan kesihatan pelanggan dengan konteks jualan merangkumi cara menggabungkan saluran pengembangan dan risiko pembaharuan ke dalam rekod akaun yang sama, supaya angka ARR yang CS Ops tarik untuk model pemarkahan mencerminkan realiti perniagaan semasa, bukan snapshot CRM enam bulan lalu.
Pemarkahan kekerapan aduan mengutamakan berdasarkan jumlah akaun unik yang melaporkan. Ini betul untuk permainan penggunaan yang luas dan model PLG di mana metriknya adalah berapa ramai pelanggan menggunakan ciri itu, bukan berapa banyak hasil yang mereka wakili. Ini salah sebagai satu-satunya input kerana ia mengabaikan impak hasil dan memberi bobot yang sama kepada akaun $5K dan akaun $200K.
Pemarkahan berwajaran risiko mengutamakan berdasarkan korelasi risiko kadar peralihan. Akaun yang berisiko atau dalam perbualan kadar peralihan mendapat bobot yang ditingkatkan apabila mengira kes perniagaan untuk sesuatu ciri. Ini betul untuk suku tahun yang mengutamakan pengekalan dan persekitaran kadar peralihan yang tinggi. Ini salah sebagai satu-satunya input kerana ia bermakna roadmap dipacu oleh akaun yang paling tidak sihat berbukan yang paling bernilai.
Model komposit menggabungkan ketiga-tiganya. Bobot antara mereka adalah keputusan perniagaan, dan membuat keputusan itu secara jelas adalah perkara yang bernilai itu sendiri. Bahagian seterusnya menunjukkan dengan tepat cara mengiranya.
Membina Skor Impak Pelanggan Komposit
Langkah 1: Kumpulkan input untuk setiap item backlog
Untuk setiap item yang dinilai, CS perlu menyediakan empat titik data:
Faktor 1: ARR terjejas. Jumlah ARR dari semua akaun yang telah melaporkan isu ini atau meminta ciri ini. Tarik ini dari platform CS, bukan dari ingatan. Jika anda tidak mempunyai maklum balas yang ditag terhubung kepada akaun, langkah ini tidak berfungsi, itulah sebabnya saluran tiket sokongan ke backlog produk dan taksonomi maklum balas bersama adalah prasyarat.
Faktor 2: Jumlah akaun. Bilangan akaun unik yang telah melaporkan isu, dinormalkan ke skala 0-10 berdasarkan jumlah akaun anda. Jika anda mempunyai 200 akaun dan 20 telah menandai isu, itu adalah kadar penetrasi 10%. Normalkan ini supaya jumlah akaun boleh dibandingkan merentasi item tanpa mengira sama ada nombor mutlak itu 5 atau 50.
Faktor 3: Bobot risiko kadar peralihan. Bilangan akaun berisiko (skor kesihatan di bawah ambang batas, perbualan kadar peralihan terbuka, atau pembaharuan dalam masa 90 hari) yang telah melaporkan isu, didarabkan dengan pekali risiko. Pekali standard ialah 2.0. Akaun berisiko dikira dua kali dalam model pemarkahan kerana kos perniagaan kehilangan akaun itu lebih tinggi dan lebih segera.
Faktor 4: Bendera akaun strategik. Binari: adakah mana-mana akaun dinamakan/strategik muncul dalam senarai akaun terjejas? Akaun dinamakan adalah akaun yang muncul dalam senarai akaun dinamakan syarikat, biasanya akaun ARR teratas atau logo utama. Bendera ini menambah bonus tetap kepada skor kerana akaun strategik membawa nilai hubungan dan rujukan melebihi ARR mereka.
Langkah 2: Gunakan formula pemarkahan
Skor Impak Pelanggan =
  (ARR Terjejas / Jumlah ARR Syarikat × 40)
  + (Jumlah Akaun Ternormal × 25)
  + (Akaun Berisiko × 2.0 × 20 / Skor Berisiko Maksimum yang Mungkin)
  + (Bendera Akaun Strategik × 15)
Bobot (40/25/20/15) berjumlah 100 dan boleh dilaraskan berdasarkan keutamaan strategik semasa syarikat anda. Dalam suku tahun yang berfokus pengekalan, tingkatkan bobot berisiko. Dalam suku tahun pengembangan perusahaan, tingkatkan bobot ARR. Dokumentasikan rasional bobot apabila anda menetapkannya.
Langkah 3: Contoh angka berbanding (4 item backlog yang bersaing)
Konteks syarikat: Syarikat SaaS peringkat pertengahan pasaran. Jumlah ARR: $8J. Jumlah akaun: 180. Akaun dinamakan (20 teratas mengikut ARR): 20 akaun.
Item A: Eksport pukal (peningkatan had baris)
- Akaun yang melaporkan: 28 akaun unik
- ARR terjejas: $840,000
- Akaun berisiko dalam senarai: 4
- Bendera akaun strategik: Tidak (tiada akaun dinamakan terjejas)
Pemarkahan:
- Komponen ARR: ($840K / $8J) × 40 = 4.2
- Komponen jumlah akaun: 28/180 = 15.6%, ternormal: 15.6/20 × 10 = 7.8 × 25/10 = 19.5
- Komponen berisiko: (4 × 2.0) = 8. 8/30 × 20 = 5.3
- Bendera strategik: 0
Jumlah Item A: 4.2 + 19.5 + 5.3 + 0 = 29.0
Item B: Integrasi kalendar (sinkronisasi asli)
- Akaun yang melaporkan: 11 akaun unik
- ARR terjejas: $1,320,000
- Akaun berisiko dalam senarai: 1
- Bendera akaun strategik: Ya (2 akaun dinamakan terjejas)
Pemarkahan:
- Komponen ARR: ($1.32J / $8J) × 40 = 6.6
- Komponen jumlah akaun: 11/180 = 6.1%, ternormal: 6.1/20 × 10 = 3.1 × 25/10 = 7.6
- Komponen berisiko: (1 × 2.0) = 2. 2/30 × 20 = 1.3
- Bendera strategik: 15
Jumlah Item B: 6.6 + 7.6 + 1.3 + 15 = 30.5
Item C: Mod luar talian aplikasi mudah alih
- Akaun yang melaporkan: 6 akaun unik
- ARR terjejas: $190,000
- Akaun berisiko dalam senarai: 3
- Bendera akaun strategik: Tidak
Pemarkahan:
- Komponen ARR: ($190K / $8J) × 40 = 0.95
- Komponen jumlah akaun: 6/180 = 3.3%, ternormal: 3.3/20 × 10 = 1.7 × 25/10 = 4.1
- Komponen berisiko: (3 × 2.0) = 6. 6/30 × 20 = 4.0
- Bendera strategik: 0
Jumlah Item C: 0.95 + 4.1 + 4.0 + 0 = 9.05
Item D: Jenis medan tersuai (pelbagai pilihan)
- Akaun yang melaporkan: 41 akaun unik
- ARR terjejas: $510,000
- Akaun berisiko dalam senarai: 2
- Bendera akaun strategik: Ya (1 akaun dinamakan terjejas)
Pemarkahan:
- Komponen ARR: ($510K / $8J) × 40 = 2.55
- Komponen jumlah akaun: 41/180 = 22.8%, had pada 20% maks = 10 × 25/10 = 25
- Komponen berisiko: (2 × 2.0) = 4. 4/30 × 20 = 2.7
- Bendera strategik: 15
Jumlah Item D: 2.55 + 25 + 2.7 + 15 = 45.25
Ringkasan skor komposit dan cadangan PM:
| Item Backlog | Komponen ARR | Jumlah Akaun | Berisiko | Bendera Strategik | Jumlah Skor | Cadangan PM |
|---|---|---|---|---|---|---|
| D: Jenis medan tersuai | 2.55 | 25.0 | 2.7 | 15 | 45.25 | Keutamaan 1: jumlah tinggi + bendera akaun strategik mendorong ini melebihi item ARR yang lebih tinggi |
| B: Integrasi kalendar | 6.6 | 7.6 | 1.3 | 15 | 30.5 | Keutamaan 2: ARR setiap akaun tinggi dan bendera strategik; penetrasi akaun agak rendah |
| A: Eksport pukal | 4.2 | 19.5 | 5.3 | 0 | 29.0 | Keutamaan 3: jumlah akaun kuat dan bobot berisiko; pantau jika bilangan berisiko meningkat |
| C: Mod luar talian mudah alih | 0.95 | 4.1 | 4.0 | 0 | 9.05 | Keutamaan 4: asas kecil; bobot berisiko menghalangnya dari dibuang sepenuhnya |
Permukaan pemarkahan: Item D menang bukan kerana ia mempunyai impak ARR tertinggi (Item B yang ada) atau bobot berisiko tertinggi (Item A yang ada). Ia menang kerana ia mendapat skor merentasi keempat-empat dimensi: penetrasi akaun tinggi, satu akaun dinamakan, dan bobot berisiko yang mencukupi untuk mengesahkan ia adalah risiko pengekalan, bukan sekadar permintaan ciri.
Inilah nilai komposit: ia menghasilkan pangkat yang boleh dipertahankan yang tiada model satu faktor boleh hasilkan.
Cara CS Memberi Makan Skor
Model pemarkahan hanya sebaik data yang CS berikan. Untuk setiap item backlog, CSM perlu merekodkan:
- Huraian isu dalam taksonomi bersama (bukan teks bebas)
- Senarai akaun: setiap akaun yang menandai isu ini, dengan rekod akaun mereka terhubung
- ARR setiap akaun (ditarik dari CRM, bukan dianggarkan)
- Tarikh pembaharuan untuk tiga akaun yang paling hampir pembaharuan
- Skor kesihatan akaun pada masa merekodkan
- Sebarang bahasa pelanggan verbatim yang patut dipelihara untuk pasukan produk
Siapa yang memperkaya skor: CS Ops, bukan CSM individu. CSM individu menandai maklum balas dalam platform CS. CS Ops mengagregasikan, memperkaya dengan data ARR dari CRM, dan menjalankan formula pemarkahan. Pemisahan ini memastikan data konsisten dan menghalang CSM individu daripada secara tidak sengaja mengelembungkan skor untuk akaun mereka sendiri.
Kadens: Pemarkahan berkumpulan dua kali sebulan. Pemarkahan masa nyata memperkenalkan bunyi bising. Satu laporan baharu tidak sepatutnya mengalihkan keutamaan dalam kitaran sprint mingguan. Pemarkahan dua kali sebulan memberikan masa yang cukup untuk data terkumpul sebelum ia mempengaruhi perbincangan roadmap.
Cara Product Menggunakan Skor
Di mana skor berada: Dalam backlog produk sebagai medan tersuai, bukan dalam hamparan CS yang berasingan. Jika skor berada dalam hamparan, ia akan dirujuk kadangkala. Jika ia medan dalam alat backlog, ia kelihatan setiap kali PM membuka item backlog.
Cara menimbanginya berbanding input lain: Skor impak pelanggan adalah satu input antara beberapa dalam pengutamaan roadmap. Hutang teknikal, pertaruhan produk strategik, keperluan kawal selia, dan kerumitan kejuruteraan semuanya termasuk dalam perbualan yang sama. Bobot permulaan yang munasabah untuk skor impak pelanggan adalah 30-40% daripada skor pengutamaan keseluruhan.
Skor adalah pengganda, bukan mandat: Skor impak pelanggan 45 tidak bermaksud ciri itu dihantar sprint seterusnya. Ia bermaksud ciri itu mempunyai kes pelanggan yang kuat yang harus mempengaruhi perbualan pengutamaan. PM yang mengatasi item yang mendapat skor tinggi kerana kekangan teknikal atau pertimbangan strategik tidak mengabaikan sistem. Mereka menggunakan pertimbangan mereka, yang dimaklumkan oleh sistem. Itulah penggunaan yang dimaksudkan.
Kes Tepi dan Pemecah Seri
Akaun ARR rendah dengan suara yang tidak seimbang: Akaun $10K yang CSM-nya sangat aktif dan penulis yang baik secara semula jadi akan menghasilkan lebih banyak maklum balas yang direkodkan berbanding akaun $200K dengan hubungan CSM yang lebih pasif. Komponen ARR menangani ini secara automatik. Maklum balas akaun ARR rendah menyumbang lebih sedikit kepada komponen ARR tanpa mengira berapa kali isu itu direkodkan.
Satu akaun perusahaan mendorong skor yang sebaliknya akan kalah: Ini berfungsi seperti yang direka bentuk, bukan pepijat. Jika akaun $600K adalah satu-satunya yang melaporkan isu dan satu akaun itu mewakili 7.5% daripada jumlah ARR, komponen ARR sahaja menghasilkan skor yang bermakna. Tambah bendera strategik jika mereka adalah akaun dinamakan dan skor komposit mencerminkan kepentingan perniagaan sebenar mereka.
Akaun berisiko semua mahukan ciri yang bertentangan strategi: Nilaikan item menggunakan model. Kemudian PM mengkaji semula cadangan dan membuat penilaian: "Item ini mendapat skor 28 terutamanya kerana bobot berisiko, tetapi ciri itu tidak konsisten dengan strategi produk semasa kami. Kami tidak dapat membinanya. Apa yang CS boleh lakukan untuk mengekalkan akaun ini tanpa perubahan produk?" Itulah perbualan yang betul. Dan ia adalah perbualan yang lebih baik daripada yang bermula dengan "pelanggan ini akan meninggalkan melainkan kami membina ini."
Perangkap: Cara Pasukan Merosakkan Model
Penyelidikan McKinsey tentang pengurus produk terbaik mendapati bahawa PM terbaik melayan data pelanggan sebagai satu input antara beberapa. Mereka menggunakan model pemarkahan untuk memaklumkan pengutamaan, bukan untuk menggantikan penilaian yang memerlukan konteks strategik, kebolehlaksanaan teknikal, dan kesedaran persaingan.
CS memilih akaun yang disertakan. Jika CSM secara selektif merekodkan maklum balas dari akaun yang mereka tahu akan mengelembungkan skor, model menghasilkan output yang berat sebelah. Selesaikan ini secara struktural: semua item maklum balas yang direkodkan masuk ke dalam agregat secara automatik. CSM tidak memilih akaun mana yang disertakan dalam pemarkahan. Jika CSM akaun merekodkan maklum balas menggunakan taksonomi standard, ia disertakan.
Skor tidak dikemas kini apabila status akaun berubah. Akaun yang diperbaharui dan berubah dari kuning ke hijau masih mempunyai bobot risiko kadar peralihan dari enam bulan lalu jika tiada siapa mengemas kininya. CS Ops harus menjalankan penyegaran status akaun suku tahunan: mengemas kini skor kesihatan, jadual pembaharuan, dan status akaun dinamakan untuk semua akaun dalam pangkalan data pemarkahan. Kajian semula maklum balas pelanggan suku tahunan adalah titik pemeriksaan semula jadi untuk penyegaran ini, di mana product dan CS bersama mengesahkan sama ada skor suku tahun lalu meramalkan hasil yang betul sebelum menentukur semula bobot.
Melayan skor sebagai enjin pangkat berbanding input. Model ini memeringkatkan item backlog mengikut impak pelanggan. Ia tidak memeringkatkan mengikut apa yang perlu dibina seterusnya. Kerumitan kejuruteraan, kesesuaian strategik, dan hutang teknikal semuanya termasuk dalam perbualan. Pasukan yang mula melayan skor impak pelanggan sebagai keseluruhan jawapan pengutamaan akan membuat keputusan yang tidak koheren secara teknikal, menghantar ciri berskor tinggi yang tidak dapat dibina dalam masa yang dijangka roadmap.
Cara Ini Menghubungkan kepada Pengecaman Corak dan Sistem Maklum Balas
Pemarkahan impak pelanggan adalah lapisan pengkuantifikasian yang berada di atas pengecaman corak merentasi CSM. Pengecaman corak mengenal pasti bahawa tema wujud. Lima CSM telah mendengar aduan eksport pukal. Pemarkahan impak pelanggan menjawab soalan perniagaan: seberapa penting ia?
Pengkuantifikasian maklum balas berwajaran ARR merangkumi lapisan pemodelan kewangan dengan lebih terperinci, khususnya cara menormalkan impak ARR merentasi saiz akaun yang berbeza. Masalah perkuburan permintaan ciri adalah akibat hiliran backlog tanpa pemarkahan: permintaan terkumpul, tiada yang dihantar, pelanggan berhenti menghantar.
Mengutamakan maklum balas pelanggan tanpa tenggelam di dalamnya merangkumi lapisan penapisan pengambilan yang memastikan hanya maklum balas yang diberi skor dan berstruktur sampai ke pasukan produk. Dan kajian semula maklum balas pelanggan suku tahunan adalah tempat model pemarkahan disahkan terhadap hasil sebenar: adakah item yang kami utamakan menghasilkan hasil pengekalan dan penggunaan yang diramalkan skor?
Analisis Rework: Dalam analisis kami tentang corak pengutamaan SaaS peringkat pertengahan pasaran, mod kegagalan paling biasa bukan memilih formula pemarkahan yang salah. Ia menggunakan skor sebagai enjin pangkat berbanding input. Skor Impak Pelanggan 4 Faktor adalah pengganda pada pertimbangan PM, bukan pengganti untuknya. Pasukan yang mendapat nilai paling banyak dari model ini menjalankan kitaran pemarkahan dua kali sebulan (bukan masa nyata), menyimpan skor sebagai medan tersuai terus dalam alat backlog (bukan hamparan berasingan), dan melakukan penentukuran semula bobot suku tahunan di mana mereka membandingkan item berskor teratas suku tahun lalu terhadap hasil sebenar. Sesi penentukuran semula biasanya mendedahkan sama ada pekali berisiko (2.0) diskala dengan betul untuk persekitaran kadar peralihan semasa. Dalam suku tahun kadar peralihan tinggi, pekali 2.5-3.0 mungkin lebih baik mencerminkan kos perniagaan sebenar kehilangan akaun berisiko.
Ketahui Lebih Lanjut
- Maklum Balas Berwajaran ARR: Mengkuantifikasikan Suara Pelanggan
- Pengecaman Corak Merentasi CSM: Isu Sistematik
- Masalah Perkuburan Permintaan Ciri
- Mengutamakan Maklum Balas Pelanggan (Tanpa Tenggelam di Dalamnya)
- Kajian Semula Maklum Balas Pelanggan Suku Tahunan (Bersama)
Soalan Lazim
Apakah Skor Impak Pelanggan 4 Faktor?
Skor Impak Pelanggan 4 Faktor adalah model pemarkahan komposit 0-100 yang mengkuantifikasikan kes perniagaan pelanggan untuk setiap item backlog produk. Empat faktornya ialah: ARR Terjejas (bobot 40%), Jumlah Akaun Ternormal (bobot 25%), Bobot Akaun Berisiko dengan pekali kadar peralihan 2.0 (bobot 20%), dan Bendera Akaun Strategik, bonus binari untuk akaun dinamakan/perusahaan (bobot 15%). Formulanya ialah: (ARR Terjejas / Jumlah ARR × 40) + (Jumlah Akaun Ternormal × 25) + (Akaun Berisiko × 2.0 × 20 / Skor Berisiko Maksimum yang Mungkin) + (Bendera Akaun Strategik × 15). Bobot berjumlah 100 dan boleh dilaraskan mengikut keutamaan suku tahun strategik.
Mengapa kiraan aduan mentah tidak berfungsi untuk pengutamaan produk?
Kiraan mentah menghasilkan tiga berat sebelah sistematik. Berat sebelah jumlah: ciri yang 50 pelanggan kecil mahukan mengatasi ciri yang 3 pelanggan perusahaan perlukan, walaupun ciri perusahaan mewakili 3 kali ARR. Berat sebelah roda berderit: pelanggan yang menulis permintaan terperinci dan bertindak balas kepada setiap tinjauan adalah suku yang paling aktif terlibat. Mereka tidak mewakili, dan pengguna yang senyap meninggalkan tidak pernah muncul dalam kiraan aduan. Berat sebelah kebaruan: apa yang timbul bulan ini diutamakan berbanding isu ekor panjang kronik dengan lebih banyak laporan jumlah selama lapan bulan. Model 4 Faktor menangani ketiganya dengan menormalkan merentasi ARR, menggunakan pekali kadar peralihan, dan melihat kekerapan kumulatif berbanding kebaruan.
Bagaimana bobot akaun berisiko berfungsi dalam model pemarkahan?
Akaun berisiko (ditakrifkan sebagai akaun dengan skor kesihatan di bawah ambang batas, perbualan kadar peralihan terbuka, atau pembaharuan dalam masa 90 hari) menerima pekali kadar peralihan 2.0 apabila ia muncul dalam senarai akaun terjejas. Akaun berisiko dikira dua kali dalam model pemarkahan kerana kos perniagaan kehilangan akaun itu lebih tinggi dan lebih segera berbanding kos akaun sihat yang mengalami geseran yang sama. Dalam contoh berbanding: Item A (eksport pukal) mendapat skor 5.3 pada komponen berisiko kerana 4 akaun berisiko terjejas, menggunakan 2.0x masing-masing terhadap skor berisiko maksimum yang mungkin sebanyak 30. Bobot berisiko itu meningkatkan Item A ke Keutamaan 3 walaupun ARR setiap akaun lebih rendah berbanding Item B.
Apakah bendera akaun strategik dan bila ia terpakai?
Bendera akaun strategik adalah bonus skor binari sebanyak 15 mata yang digunakan apabila sekurang-kurangnya satu akaun dinamakan/perusahaan muncul dalam senarai akaun terjejas. Akaun dinamakan ditakrifkan sebagai akaun ARR teratas syarikat mengikut bilangan yang dipersetujui lebih awal (biasanya 20 akaun teratas mengikut ARR). Bendera terpakai kerana akaun strategik membawa nilai hubungan dan rujukan melebihi angka ARR mereka. Dalam contoh berbanding, Item B dan D kedua-duanya menerima bendera 15 mata. Inilah yang mendorong Item D (jenis medan tersuai) ke Keutamaan 1 walaupun impak ARR setiap akaun lebih rendah berbanding Item B, digabungkan dengan skor penetrasi akaun yang tinggi.
Berapa kerap skor impak pelanggan harus dikemas kini?
Dua kali sebulan. Pemarkahan masa nyata memperkenalkan bunyi bising. Satu laporan akaun baharu tidak sepatutnya mengalihkan keutamaan dalam kitaran sprint mingguan. Pemarkahan dua kali sebulan memberikan masa yang cukup untuk data terkumpul sebelum ia mempengaruhi perbincangan roadmap. Selain itu, CS Ops harus menjalankan penyegaran status akaun suku tahunan: mengemas kini skor kesihatan, jadual pembaharuan, dan status akaun dinamakan untuk semua akaun dalam pangkalan data pemarkahan. Akaun yang diperbaharui dan berubah dari kuning ke hijau masih mempunyai bobot risiko kadar peralihannya dari enam bulan lalu jika tiada siapa mengemas kininya, yang menghasilkan skor yang melebih-lebihkan risiko pengekalan untuk akaun yang kini stabil.
Bagaimana pasukan produk harus menimbang skor impak pelanggan berbanding input pengutamaan lain?
Bobot permulaan yang munasabah untuk skor impak pelanggan adalah 30-40% daripada skor pengutamaan keseluruhan. Baki bobot merangkumi hutang teknikal, pertaruhan produk strategik, keperluan kawal selia, dan kerumitan kejuruteraan. Skor impak pelanggan 45 tidak bermaksud ciri itu dihantar sprint seterusnya. Ia bermaksud ciri itu mempunyai kes pelanggan yang kuat yang harus menjadi faktor penting dalam perbualan pengutamaan. Menurut penyelidikan McKinsey tentang pengurus produk terbaik, PM terbaik melayan data pelanggan sebagai satu input antara beberapa, menggunakan model pemarkahan untuk memaklumkan pengutamaan berbukan untuk menggantikan penilaian yang memerlukan konteks strategik dan kesedaran kebolehlaksanaan teknikal.

Senior Operations & Growth Strategist
On this page
- Mengapa Kiraan Aduan Mentah Gagal
- Tiga Falsafah Pemarkahan
- Membina Skor Impak Pelanggan Komposit
- Langkah 1: Kumpulkan input untuk setiap item backlog
- Langkah 2: Gunakan formula pemarkahan
- Langkah 3: Contoh angka berbanding (4 item backlog yang bersaing)
- Cara CS Memberi Makan Skor
- Cara Product Menggunakan Skor
- Kes Tepi dan Pemecah Seri
- Perangkap: Cara Pasukan Merosakkan Model
- Cara Ini Menghubungkan kepada Pengecaman Corak dan Sistem Maklum Balas
- Ketahui Lebih Lanjut
- Soalan Lazim
- Apakah Skor Impak Pelanggan 4 Faktor?
- Mengapa kiraan aduan mentah tidak berfungsi untuk pengutamaan produk?
- Bagaimana bobot akaun berisiko berfungsi dalam model pemarkahan?
- Apakah bendera akaun strategik dan bila ia terpakai?
- Berapa kerap skor impak pelanggan harus dikemas kini?
- Bagaimana pasukan produk harus menimbang skor impak pelanggan berbanding input pengutamaan lain?