Value Chain Analysis: Porter's Model Explained (With Real Examples)
Turn this article into takeaways for your work.


Each assistant summarizes the article only for you and suggests best practices for your work.
Every CEO eventually has to answer the same question: where does our margin actually come from? Value chain analysis gives you a structured way to answer it, by breaking your business into distinct activities and asking which ones create value and which ones quietly eat it.
What is value chain analysis?
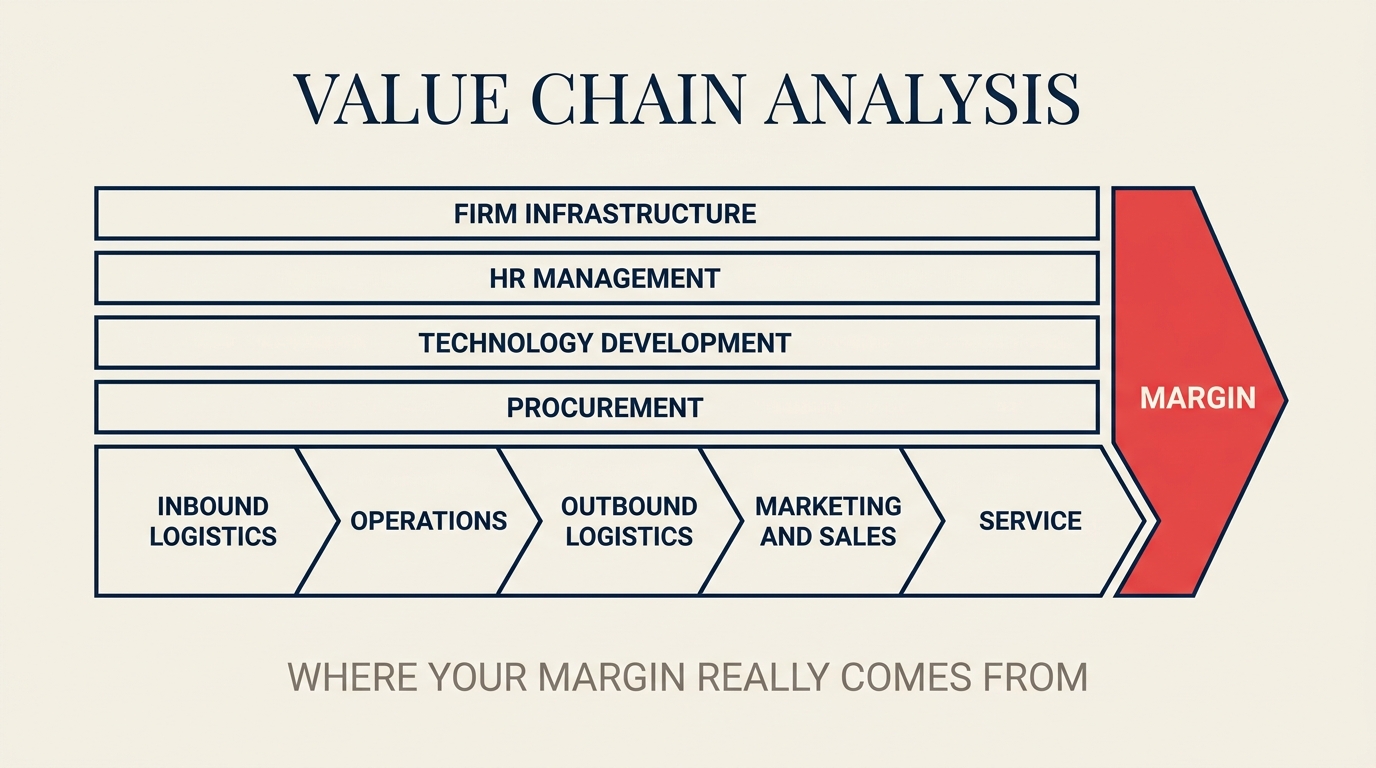
Value chain analysis is a strategic framework introduced by Michael E. Porter in his 1985 book Competitive Advantage: Creating and Sustaining Superior Performance (Free Press). It breaks a business into 9 activities, 5 primary activities and 4 support activities, and examines how each one either creates value or incurs cost on the way to margin. The goal isn't just to understand cost. It's to find where your business can win: either by doing things cheaper than everyone else, or by doing them in a way that customers will pay a premium for.
Value in Porter's model means what customers are willing to pay. Margin is what's left after you subtract the total costs of every activity from that value. The analysis makes the trade-offs visible.
Key Facts
- Porter, M.E. (1985) Competitive Advantage: Creating and Sustaining Superior Performance, Free Press, Chapter 2, the original source of the value chain concept. Porter argued that competitive advantage comes from the specific activities a firm performs, not from the firm as a whole.
- "Competitive advantage cannot be understood by looking at a firm as a whole. It stems from the many discrete activities a firm performs in designing, producing, marketing, delivering, and supporting its product.", Michael E. Porter, Competitive Advantage (1985), p. 33.
- McKinsey's 2024 report on value chain reconfiguration found that companies that redesigned even one or two primary activities, such as switching to direct-to-consumer fulfillment or in-housing a previously outsourced operation, captured 15-25% improvement in gross margin within two years of implementation.
The 5 primary and 4 support activities
The 9 activities sit in two tiers. Primary activities run left to right across the value chain and directly touch the product or service on its way to the customer. Support activities sit above them and enable all five primary activities to function.

Primary activities
- Inbound Logistics, receiving, storing, and distributing inputs: raw materials, components, data, or anything else your operations need to start work.
- Operations, transforming those inputs into the finished product or service: manufacturing, assembly, software compilation, food preparation, service delivery.
- Outbound Logistics, getting the finished output to buyers: warehousing, order fulfillment, shipping, digital distribution, last-mile delivery.
- Marketing and Sales, activities that let buyers know the product exists and persuade them to buy: advertising, channel management, pricing, sales force, promotions.
- Service, maintaining and enhancing the product after sale: installation, warranty support, training, repair, upgrades, customer success.
Support activities
- Firm Infrastructure, general management, finance, legal, planning, quality management, the overhead that supports every primary activity without being tied to any single one.
- Human Resource Management (HRM), recruiting, training, compensation, retention, the people architecture that determines whether every other activity runs well or poorly.
- Technology Development, research and development (R&D), process automation, software, product innovation, any use of technology to improve activities or outputs.
- Procurement, purchasing inputs across all activities: not just raw materials, but also equipment, office supplies, consulting services, and software licenses.
The arrows in Porter's diagram all point right toward margin. Margin is value created minus cost incurred.
How to do a value chain analysis in 5 steps
A useful value chain analysis moves from a granular activity map to a deliberate choice about cost reduction or differentiation.

Step 1: Map every activity
List every activity your company performs and assign it to one of the nine categories. Be specific. "Operations" at an airline means crew scheduling, ground handling, and maintenance. At a law firm it means case research, drafting, and court appearances. Resist the urge to stay vague. The more granular your activity map, the more useful the analysis.
Step 2: Cost each activity
Assign costs to each activity. You don't need perfect accounting precision, directional accuracy is enough at this stage. Include direct labor, technology, overhead, and time costs. Some companies find that 80% of cost sits in two or three activities, which immediately narrows the focus.
Step 3: Identify value drivers
For each activity, ask: what does the customer actually care about here? Inbound logistics speed matters in fast fashion but barely registers in furniture. Service quality matters enormously in enterprise software and barely at all in commodity manufacturing. The activities where customers feel the difference are your value drivers.
Step 4: Benchmark against competitors
How does your activity cost and quality compare to competitors? Use public benchmarks, supplier conversations, job postings (which reveal hiring patterns), and customer feedback. If a competitor is consistently faster at outbound logistics, look at whether they've automated fulfillment differently. Gap analysis at the activity level reveals strategic options.
Step 5: Prioritize for cost reduction or differentiation
Armed with cost data, value drivers, and competitive gaps, you now choose a path. Cut costs in activities that don't drive customer value. Invest heavily in activities that do. This is where the value chain connects directly to Porter's two generic strategies, cost leadership and differentiation, which we'll cover below.
Worked example: IKEA value chain analysis
IKEA is a classic value chain case because its cost advantages aren't accidental. They're the result of deliberate activity-level choices that reinforce each other across the entire chain.

| Activity | What IKEA does | Cost or Differentiation lever |
|---|---|---|
| Inbound Logistics | Sources globally, consolidates shipments, owns some supplier relationships for 20+ years | Cost, volume purchasing, fewer intermediaries |
| Operations | In-house flat-pack design; products engineered from the start for compact manufacturing | Cost, reduces material waste and manufacturing complexity |
| Outbound Logistics | Flat-pack dramatically reduces shipping volume per unit; customers collect from large out-of-town stores | Cost, lower freight cost per unit; customer collects, eliminating last-mile delivery |
| Marketing and Sales | Annual catalog (historically one of the world's most distributed print publications); showroom as marketing vehicle | Differentiation, the store experience is the pitch; low advertising spend per sale |
| Service | Self-assembly transferred to the customer; minimal post-sale service model | Cost, labor cost of assembly shifted to buyer |
| Firm Infrastructure | Lean headquarters in the Netherlands; flat management; franchise structure | Cost, low corporate overhead |
| HRM | Store staff trained as generalists; self-service model reduces headcount per square foot | Cost, lower labor intensity per transaction |
| Technology Development | In-house product design software; proprietary flat-pack engineering | Differentiation, proprietary capability competitors can't easily copy |
| Procurement | Centralized global procurement; long-term supplier contracts at scale | Cost, price pressure and stability from long-term relationships |
The pattern is consistent: IKEA designs cost out of the activities customers don't value (delivery, assembly, premium location), and invests in the activities that drive the experience customers pay for (product design, the showroom journey). That's value chain thinking in practice.
Value chain examples by industry
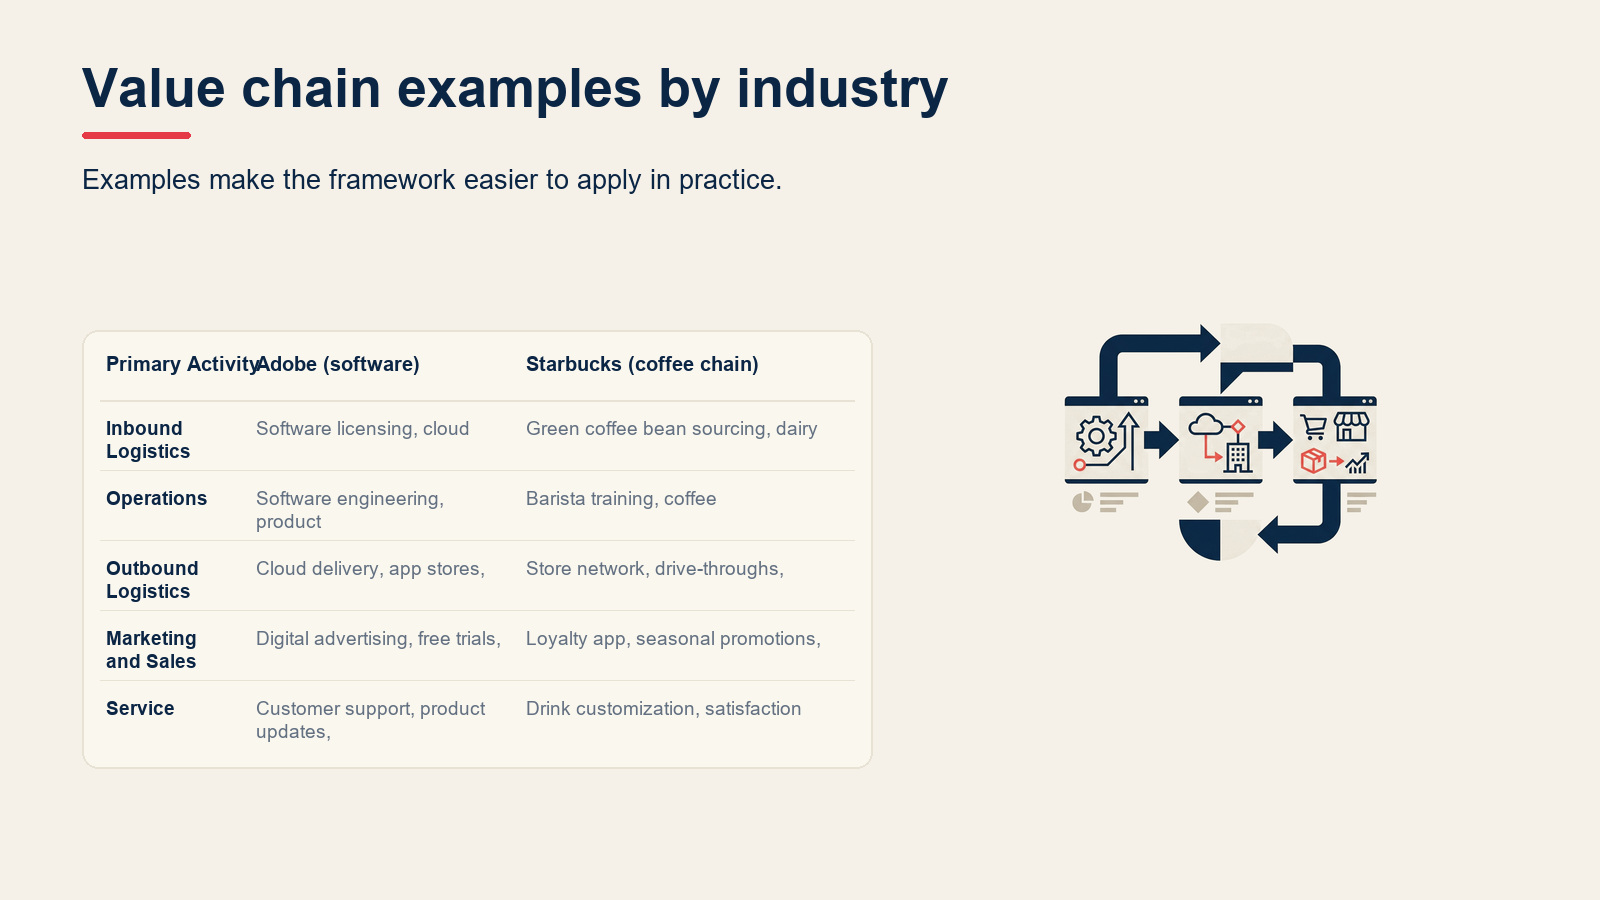
The five primary activities look very different depending on the industry. Here's how three sectors compare on the same activities.
| Primary Activity | Adobe (software) | Starbucks (coffee chain) | Urban hospital |
|---|---|---|---|
| Inbound Logistics | Software licensing, cloud infrastructure, talent acquisition | Green coffee bean sourcing, dairy supply chains, equipment procurement | Drug and supply procurement, medical equipment, staff scheduling |
| Operations | Software engineering, product development, cloud operations | Barista training, coffee preparation, store operations | Clinical care delivery, surgery, diagnostics, nursing |
| Outbound Logistics | Cloud delivery, app stores, digital download | Store network, drive-throughs, mobile ordering and pick-up | Patient discharge, referral network, outpatient scheduling |
| Marketing and Sales | Digital advertising, free trials, inside sales, reseller channels | Loyalty app, seasonal promotions, brand storytelling | Physician referrals, brand reputation, health plan contracts |
| Service | Customer support, product updates, community forums | Drink customization, satisfaction guarantees, barista re-dos | Post-discharge follow-up, chronic disease management, patient portal |
What the table shows is that "Operations" for Adobe is almost entirely intellectual, it happens in code and on servers. For Starbucks, it happens in a 10-square-meter space with an espresso machine and a queue. And for a hospital, operations are deeply regulated, high-stakes, and largely manual. The value chain framework applies across all three, but the activity content is completely different. That's the model's power: it gives you a common language for analyzing wildly different businesses.
Cost leadership vs differentiation: two strategies the value chain reveals
Porter's two generic strategies, cost leadership and differentiation, map directly onto how you optimize your value chain.
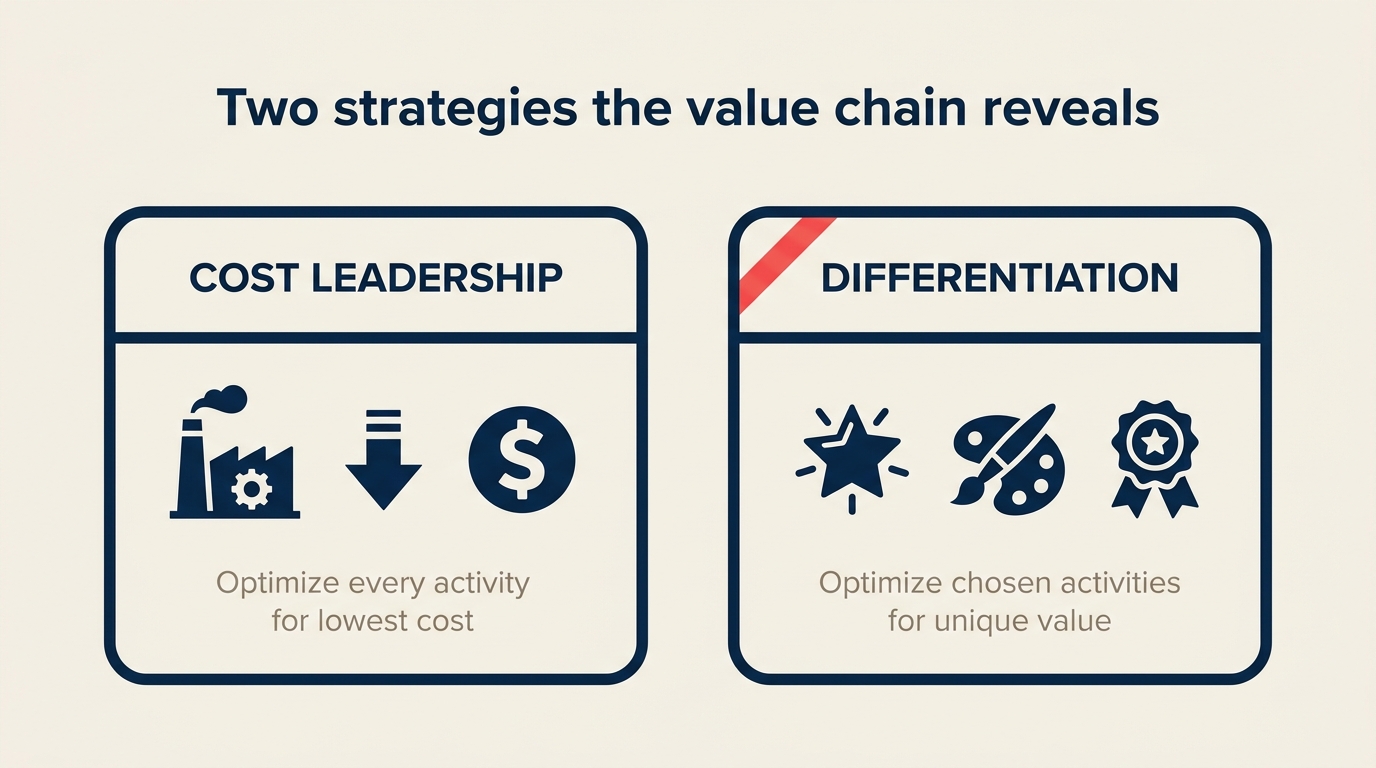
Cost leadership means you configure every activity for the lowest possible cost. You automate inbound logistics. You standardize operations. You minimize service overhead. You negotiate hard on procurement. The goal is to be the lowest-cost producer in the industry while still meeting the baseline quality threshold customers require. IKEA, Ryanair, and Amazon Basics all run cost-leadership value chains.
Differentiation means you invest heavily in the activities that deliver unique value, and you accept higher costs in those areas, because customers will pay a premium. Apple invests massively in Technology Development and Marketing and Sales. Nordstrom invests in Service. A boutique law firm invests in talent (HRM) and partner-level Operations. The value chain analysis tells you which activities are worth the premium spend.
The common mistake is trying to do both simultaneously without a clear priority. Porter argued that firms "stuck in the middle", not the cheapest and not clearly differentiated, tend to earn below-average returns because they're easily attacked from both directions. Choosing a lane requires actually looking at your activity costs and asking: which activities are we optimizing, and for what?
For a deeper look at the competitive forces that determine how much of that margin you get to keep once you've built it, see Porter's Five Forces.
Value chain analysis vs supply chain analysis
These two terms get confused constantly. Here's the distinction.

| Aspect | Value chain analysis | Supply chain analysis |
|---|---|---|
| Scope | Internal + external; all 9 activity types including marketing, HR, and infrastructure | Primarily external flows of materials and goods from supplier to end customer |
| Focus | Where value and cost are created across the whole business | Logistics efficiency, supplier relationships, inventory, and delivery |
| Goal | Identify sources of competitive advantage or cost reduction | Optimize speed, cost, and reliability of material and product flows |
| Origin | Porter (1985), strategic management | Operations management, logistics theory |
| Output | A strategic map of which activities to invest in or cut | An operational map of how to move goods faster and cheaper |
| Who uses it | Strategy and leadership teams | Operations, procurement, and supply chain teams |
A supply chain is a subset of the value chain. Your supply chain covers inbound logistics, parts of operations, and outbound logistics. Value chain analysis covers those three plus marketing and sales, service, and all four support activities. If you're only looking at the supply chain, you're looking at roughly a third of your cost and value creation picture.
For broader environmental context that should frame any value chain work, PESTEL analysis helps you spot external forces, regulation, technology, economic shifts, that will reshape which activities matter most in the next three to five years.
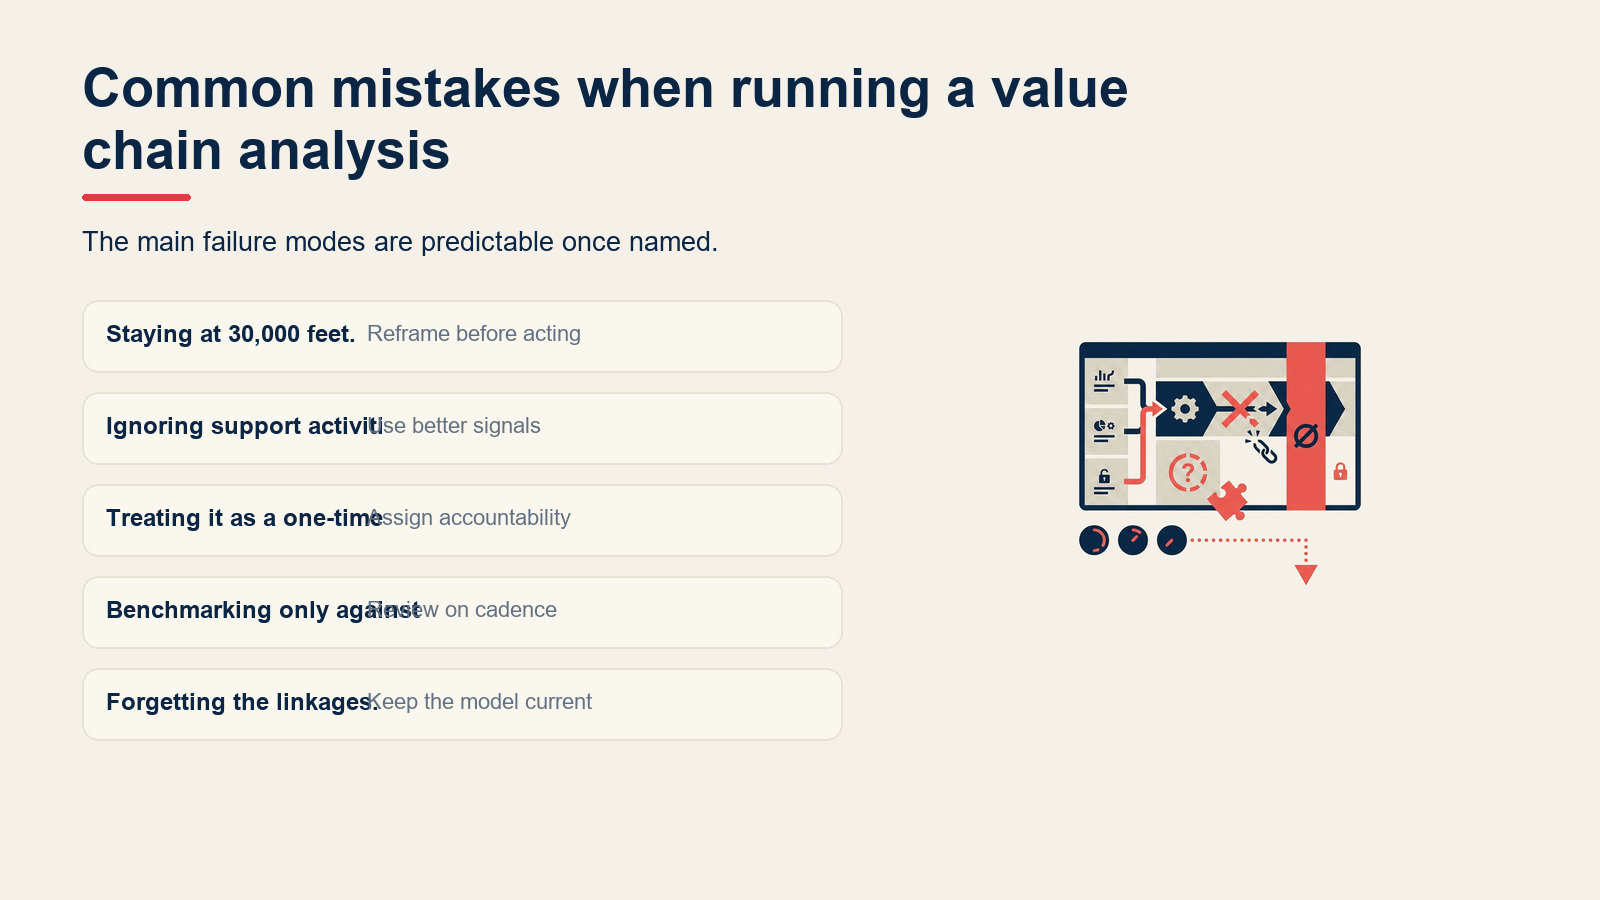
Common mistakes when running a value chain analysis
- Staying at 30,000 feet. Listing "Operations" as a single line item tells you nothing. Break it into the specific sub-activities your business actually runs and cost each one individually.
- Ignoring support activities. Companies routinely over-focus on the five primary activities and overlook HRM and Technology Development, which are often where the most durable advantages are built (or where the biggest cost bloat hides).
- Treating it as a one-time exercise. A value chain drawn in 2019 looks nothing like one drawn in 2024 for the same company. Competitive moves, technology changes, and supply disruptions reshape which activities matter. Run the analysis annually at minimum.
- Benchmarking only against direct competitors. The most dangerous threats often come from adjacent businesses that have reconfigured a subset of your value chain. Streaming platforms didn't think their benchmarks were traditional TV networks, they benchmarked against time spent on every leisure activity.
- Forgetting the linkages. Porter emphasized that activities don't just matter individually, how they connect matters too. IKEA's flat-pack design advantage isn't in Operations alone. It links through to inbound logistics (compact inputs), outbound logistics (compact outputs), and procurement (engineered-to-cost supplier specs). A change in one activity always ripples through others.
For a complementary inside-out view, SWOT analysis sits well alongside value chain work, the chain tells you where costs and value sit, and the SWOT helps you articulate which of those are genuine strengths versus areas of real vulnerability.
The value chain is not a complicated model. It asks one question repeatedly: is this activity creating value worth more than it costs? Run it honestly and it shows you, with more precision than most strategy tools, exactly where your competitive advantage lives, and where it doesn't. From there, the path to better margin is a series of deliberate choices about which activities to optimize, which to cut, and which to invest in far more than you are today.
For frameworks that work alongside value chain analysis at different layers of strategy, see Ansoff Matrix for growth direction decisions, BCG Matrix for portfolio allocation, and Business Model Canvas for mapping how your value chain connects to revenue streams and customer segments. If you want to layer evolution onto the chain and see which activities to build versus buy, Wardley mapping plots each component against how mature and predictable it has become.

Co-Founder & COO
On this page
- What is value chain analysis?
- The 5 primary and 4 support activities
- Primary activities
- Support activities
- How to do a value chain analysis in 5 steps
- Step 1: Map every activity
- Step 2: Cost each activity
- Step 3: Identify value drivers
- Step 4: Benchmark against competitors
- Step 5: Prioritize for cost reduction or differentiation
- Worked example: IKEA value chain analysis
- Value chain examples by industry
- Cost leadership vs differentiation: two strategies the value chain reveals
- Value chain analysis vs supply chain analysis
- Common mistakes when running a value chain analysis