Perceptual Mapping: How to Position Your Brand (With Examples)
Turn this article into takeaways for your work.


Each assistant summarizes the article only for you and suggests best practices for your work.
A perceptual map is one of the most direct tools a strategist has for understanding where a brand stands in a customer's mind relative to every other option in the market. Unlike financial models or competitive databases, it works with the thing that actually drives purchase decisions: perception.
Customers don't buy features. They buy the story they tell themselves about what a product is. A perceptual map makes that story visible.
What Is a Perceptual Map?
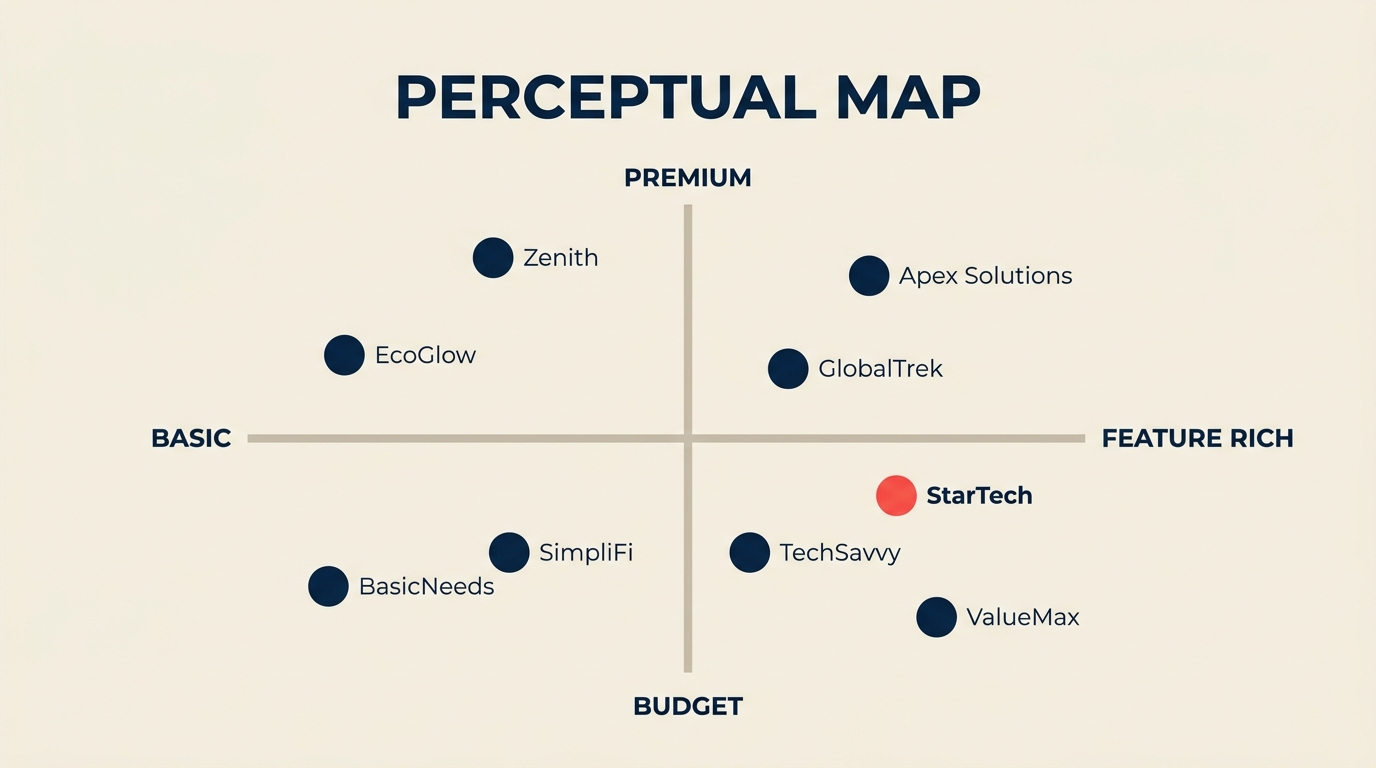
A perceptual map (also called a positioning map or brand map) plots competing brands on two perception-based axes, showing how customers mentally categorize those brands relative to each other. Each axis represents an attribute that matters to buyers, such as price, quality, reliability, or prestige. Each brand gets a dot. The result is a visual snapshot of the competitive landscape as customers actually see it, not as companies market themselves.
The concept grew from multidimensional scaling research in psychology and was brought into mainstream marketing strategy by Jack Trout and Al Ries in their landmark 1981 book Positioning: The Battle for Your Mind. Their core argument: the market rewards the brand that owns a clear position in the customer's mind, not necessarily the objectively best product.
That framing still holds. When a customer evaluates options quickly, they rely on mental shortcuts, and a perceptual map lets you see exactly which shortcuts your brand triggers.
Key Facts: Perceptual Mapping
- The concept of positioning as a strategic discipline was formally introduced by Jack Trout and Al Ries in Positioning: The Battle for Your Mind (1981), which argued that mind-share, not market-share, determines long-term brand success.
- Perceptual mapping is rooted in multidimensional scaling (MDS), a statistical technique from cognitive psychology used since the 1950s to convert perceived similarity ratings into spatial maps.
- Research in the Journal of Marketing Research has found that brands positioned in low-competition perceptual "white space" tend to command a sustained price premium relative to brands clustered in crowded quadrants, because distinctiveness reduces direct comparison.
Perceptual Map vs Strategic Group Map
These two tools look similar on paper but answer different questions. Mixing them up leads to misreading the market.

| Dimension | Perceptual Map | Strategic Group Map |
|---|---|---|
| What it measures | Customer perception of brand attributes | Firms' actual strategic choices (scope, capabilities, cost structure) |
| Data source | Customer surveys, focus groups, brand tracking | Industry analysis, financial data, observable strategy |
| Axes represent | How buyers experience or imagine a brand | How companies actually compete (price tier, distribution breadth, R&D spend) |
| Primary use | Positioning, messaging, gap discovery | Competitive benchmarking, threat assessment |
| Who owns it | Marketing and brand teams | Strategy and corporate development teams |
| Key risk | May not reflect reality (perception can lag facts) | Misses perception gaps that drive actual purchase |
You need both. A strategic group map tells you what competitors are doing. A perceptual map tells you whether customers have noticed. Often they diverge, and the gap between the two is where positioning opportunities hide.
This is also where the perceptual map connects to frameworks like Porter's generic strategies: if your cost leadership isn't perceived by buyers, the strategic position isn't delivering its intended value.
How to Create a Perceptual Map
Building a reliable perceptual map takes five steps. Skipping any of them produces a map that looks clean but misleads.

Step 1: Choose two attributes that buyers actually use
Pick two dimensions that genuinely drive purchase decisions in your category. The most common pair is price (budget to premium) vs. quality (basic to superior). But quality is often too vague to be useful on its own. For cars, you might use price vs. sportiness. For B2B software, you might use ease of use vs. depth of features.
The test: ask five customers, "When you're comparing options in this category, what are the two things you weigh most?" If they all name the same pair, you have your axes. If answers scatter, run a quick survey before committing.
Step 2: Define your competitive set
List every brand a customer might reasonably consider when evaluating your category. Include direct competitors, category adjacent players, and any substitute that solves the same job to be done. A narrow competitive set produces a flattering map. A realistic one produces a useful one.
Step 3: Gather perception data from customers
Survey real buyers, not your team. Ask them to rate each brand on each axis (1 to 10 works well). Run this with a sample large enough to average out individual outliers; 50 to 100 respondents is a practical floor for B2B, higher for consumer categories. You can also use existing brand tracking data, Net Promoter Score breakdowns, or analysis from tools that aggregate review sentiment.
The data must come from customers, not from your instinct about where brands sit. That distinction is the whole point.
Step 4: Plot the brands
Draw two intersecting axes. Label each end. Then place each brand as a dot using the average scores from your survey data. Cluster of dots = crowded positioning. Empty quadrant = potential white space.
Mark your own brand distinctly. Then look at the distance between your dot and the dots of the two or three brands customers most often compare you to.
Step 5: Identify gaps and decide on a positioning move
A gap in the map (an empty or lightly occupied quadrant) is a potential positioning opportunity. But not every gap is worth pursuing. Ask three questions before acting on a gap:
- Is there actual demand in that space, or is it empty because nobody wants that combination of attributes?
- Can your brand credibly move there given your current product, pricing, and distribution?
- If you shift position, what do you give up in your current quadrant?
The output of this step is a positioning decision, not just a map update. Connect it to your value proposition canvas to confirm the chosen position aligns with real customer jobs, pains, and gains.
Benefits of Perceptual Mapping
Perceptual mapping earns its place in strategy sessions for several concrete reasons.

It surfaces the competitive reality customers see, not the one you assume. Teams consistently overestimate how differentiated they appear to buyers. A map built on real survey data corrects that bias quickly.
It reveals white space. Crowded quadrants show where competition is fierce and margin pressure is high. Empty quadrants can signal opportunities, especially when they align with unmet customer needs identified through qualitative research.
It creates alignment across functions. Marketing, product, and sales often disagree about where the brand stands. A shared perceptual map gives everyone the same anchor point for positioning conversations.
It tracks positioning shifts over time. Run the same survey annually and overlay maps to see whether your repositioning efforts are actually moving the needle in customer perception.
It informs pricing. Brands in high-quality, low-competition quadrants can typically price higher without triggering comparison shopping. If your map shows you're in a crowded middle space, that's often why margin pressure is chronic.
Common Mistakes
Most perceptual mapping failures come from a few repeatable errors.
Using vanity axes. Mapping "innovative" vs. "trusted" sounds appealing but produces useless results because customers define those terms differently. Choose axes tied to specific, observable attributes buyers can meaningfully rate.
Building the map internally. Teams that plot their own positions based on product specs or marketing claims create a strategy map, not a perceptual map. The data must come from customers. Any other source defeats the purpose.
Treating it as a static snapshot. Perceptions shift with advertising, product updates, PR events, and competitor moves. A map from two years ago may show a radically different landscape than today. Perceptual maps need refreshing, not framing.
Ignoring cluster dynamics. Brands clustered tightly together will be compared directly by customers. If your dot is inside a cluster, price becomes the primary differentiator unless you find a dimension that separates you. That's worth knowing before you set your next pricing strategy.
Chasing white space without validating demand. An empty quadrant is only an opportunity if customers want what it represents. Always pair white-space discovery with qualitative interviews to confirm there's a real job to be done there.
Perceptual Map Examples
Concrete examples show how the same framework adapts to very different categories.

Automotive market (price vs. sportiness)
| Brand | Price Perception | Sportiness Perception |
|---|---|---|
| Ferrari | Ultra-premium | Extremely sporty |
| BMW | Premium | Moderately sporty |
| Toyota | Mid-range | Moderate |
| Kia | Budget | Low sportiness |
| Mazda | Mid-range | Sporty for the price |
When Mazda mapped this space in the 2010s, they found that sporty-for-the-price was underserved. Their "Zoom-Zoom" positioning moved their dot deliberately toward the sporty axis without raising price perception significantly, helping them escape the pure budget cluster.
Fast food (price vs. food quality perception)
| Brand | Price | Quality Perception |
|---|---|---|
| McDonald's | Low | Moderate |
| Chipotle | Mid-high | High |
| Subway | Low-mid | Moderate-high |
| Five Guys | Premium | High |
| Taco Bell | Very low | Low-moderate |
Chipotle found white space in the "fast food prices, sit-down quality" quadrant and built its entire brand around that position. The map would have shown this gap clearly in the early 2000s when casual fast food was still undifferentiated.
B2B software (ease of use vs. feature depth)
| Tool | Ease of Use | Feature Depth |
|---|---|---|
| Trello | Very easy | Shallow |
| Jira | Steep learning curve | Very deep |
| Asana | Moderate | Moderate-deep |
| Notion | Moderate | Deep but flexible |
| Basecamp | Easy | Moderate |
The "easy and deep" quadrant on this map is consistently underoccupied in software categories because it's hard to build. Products that credibly occupy it tend to command premium pricing and strong retention.
Best Practices
A few operating principles make perceptual mapping more reliable.
Survey your target segment, not all buyers. If you serve enterprise buyers, don't average in SMB responses. Different segments have different perceptions, and blending them produces a map that represents nobody accurately.
Map annually and after major market events. A new entrant, a viral campaign by a competitor, or a product recall can shift perception significantly. Annual refresh keeps the map current.
Overlay customer value with position. After placing brands on the map, add a rough indicator of which quadrant has the highest concentration of high-value buyers in your category. That transforms a positioning map into a revenue targeting tool.
Use multiple maps for complex categories. If your product serves two distinct buyer personas who weigh different attributes, build two maps. A single map will obscure real positioning opportunities.
Connect findings to your competitive advantage analysis. A strong perceptual position without an underlying advantage that can sustain it won't last. The map shows where you want to be. Your advantage analysis tells you whether you can stay there.
Pair with the SWOT analysis when presenting findings. The perceptual map surfaces external perception data; the SWOT integrates it with internal strengths and weaknesses to produce an actionable strategic picture.
For teams working through differentiation choices, the differentiation strategy framework gives the operational playbook for moving from perceptual insight to a position that's actually defensible. And if your map reveals a broad white space no competitor has touched, blue ocean strategy offers a structured way to test whether that space represents a real value innovation opportunity or just an empty corner.

Senior Operations & Growth Strategist
On this page
- What Is a Perceptual Map?
- Perceptual Map vs Strategic Group Map
- How to Create a Perceptual Map
- Step 1: Choose two attributes that buyers actually use
- Step 2: Define your competitive set
- Step 3: Gather perception data from customers
- Step 4: Plot the brands
- Step 5: Identify gaps and decide on a positioning move
- Benefits of Perceptual Mapping
- Common Mistakes
- Perceptual Map Examples
- Automotive market (price vs. sportiness)
- Fast food (price vs. food quality perception)
- B2B software (ease of use vs. feature depth)
- Best Practices