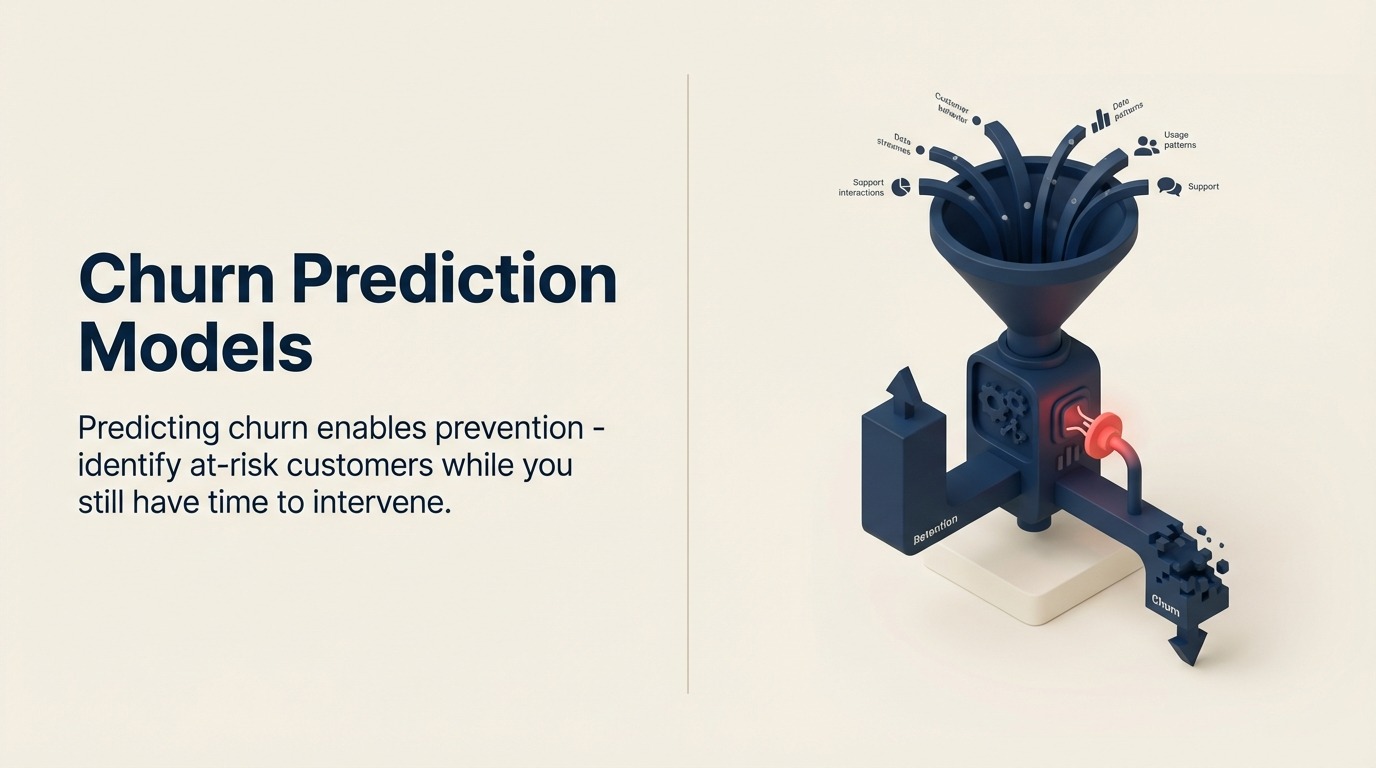
Churn Prediction Models: Using Data to Forecast Customer Loss
Turn this article into takeaways for your work.
Each assistant summarizes the article only for you and suggests best practices for your work.
Your customer sent one support ticket last month, logged in three times, and their usage dropped 30% from the previous month. Are they about to churn?
Without a prediction model, you're guessing. Maybe they're just busy. Maybe it's seasonal. Or maybe they're evaluating competitors right now and you've got two weeks to change their mind. You won't know until they formally cancel - which is too late.
Churn prediction models turn patterns in your data into early warning systems. They identify which customers are at highest risk of leaving, with enough lead time for your team to actually intervene. The best models spot at-risk customers 60-90 days before they churn, giving you a real chance to address problems and save the account.
Building these models doesn't require a data science PhD. Simple rule-based models catch 60-70% of churn. Weighted scoring models get you to 75-80%. Machine learning approaches can reach 85-90% accuracy. The key is starting with something, measuring its effectiveness, and improving over time.
Prediction Model Goals: What Good Models Achieve
Effective churn prediction models serve specific purposes.
Early identification means detecting risk before the customer has mentally decided to leave. If your model only flags customers who've already submitted cancellation notices, it's useless. You need 60-90 days of lead time to make a difference.
Gainsight's analysis shows that intervention before the 60-day mark succeeds 3x more often than intervention at 30 days or less. By then, the customer has often already evaluated alternatives and made their decision. You're just hearing about it late.
Resource prioritization helps your CS team focus limited time on the customers who need it most. You've got 500 customers and 5 CSMs. You can't give everyone high-touch attention. But you can identify the 50 at highest risk and prioritize them accordingly.
Without prediction models, CSMs either spread themselves too thin or focus on whoever complains loudest. Neither approach optimizes retention or makes efficient use of your team's time.
Intervention triggering automates responses based on risk levels. When a customer crosses a risk threshold, your system can automatically alert the CSM, trigger an outreach campaign, schedule a health review call, or escalate to management if needed. Automation ensures nothing falls through the cracks, even when your team is overwhelmed.
Forecast accuracy helps you project future revenue and churn rates with confidence. If you know 40 accounts representing $500K ARR are high-risk this quarter, you can model the financial impact and plan accordingly. Investors want to see that you understand your retention dynamics and can predict future performance. Good churn models enable exactly that.
Continuous improvement means treating your prediction model as a living system. Track its accuracy. Learn when it's wrong. Refine the inputs. Test new indicators. Models that don't improve over time become stale and lose effectiveness - they need the same attention you give to your product.
Predictive Indicators: Signals That Forecast Churn
Certain behaviors and events correlate strongly with future churn. Here's what actually matters.
Usage decline is the strongest single predictor. When active usage drops 30%+ month-over-month, churn risk spikes dramatically.
Slack found that teams whose message volume drops below a certain threshold churn at 5x the rate of active teams. They alert CSMs whenever sustained usage drops occur, giving them a chance to investigate what's happening before it's too late.
You should track login frequency (daily becoming weekly becoming monthly), feature usage breadth (using 10 features down to using 3), core action volume (API calls, documents created, users invited), and session duration and depth. Each tells part of the story about whether the customer is actually getting value.
Engagement drop shows disengaging relationships even when product usage looks okay. Declining QBR attendance, reduced response to CSM outreach, stopped attending training or webinars, dropping community participation - these signal that the customer is mentally checking out. When customers stop engaging with your team, the relationship is deteriorating regardless of what the usage numbers say.
Support ticket increase, especially with negative sentiment, signals growing frustration. Watch for spikes in tickets after periods of low volume, escalated or angry tickets, repeat issues that show lack of resolution, and tickets asking about competitors or alternatives.
HubSpot's model flags accounts with 5+ tickets in 30 days AND an NPS score below 6 as high-risk. The combination of volume and sentiment matters more than either alone.
Sentiment and satisfaction decline gets captured through NPS score drops (especially someone going from 9 to 6, or promoter to detractor), CSAT scores below threshold, negative language in support tickets, and survey responses indicating dissatisfaction.
Wootric found that customers whose NPS drops 3+ points quarter-over-quarter churn at 4x the baseline rate. Small declines in satisfaction predict large increases in churn risk.
Stakeholder and champion changes create immediate vulnerability. Your champion left the company. Reorganization eliminated the team using your product. New leadership came in who's unfamiliar with your product. Contact emails are bouncing because people are no longer there.
Single-threaded relationships become high-risk the moment that one relationship disappears. If you've only got one person who cares about your product, you're one layoff away from losing the account.
Payment and billing issues predict both voluntary and involuntary churn. Failed payment attempts, downgrade requests, requests for payment extensions, budget questions or cost concerns, declined credit cards - these all correlate with upcoming churn.
Recurly's data shows that customers with 2+ failed payments churn at 60% compared to a 5% baseline. Payment problems often indicate financial stress or deprioritization of your product.
Competitive signals indicate they're actively shopping around. Questions about integration with competitors, comparison requests, mentions of competitor names, LinkedIn activity showing interest in alternatives - when customers start researching competitors, the clock is ticking. They're building a business case for switching.
Contract and renewal timing creates natural risk windows regardless of everything else. Risk increases 90-60 days before renewal, at the end of annual contracts, during post-price increase periods, and approaching commitment end dates. Churn risk increases as renewal dates approach simply because customers reassess the relationship and alternatives during these windows.
Rule-Based Models: Simple Thresholds That Work
Start with basic rule-based models. They're simple, transparent, and surprisingly effective at catching the majority of churn.
Defining risk thresholds means setting clear, specific criteria that anyone can understand:
High risk if ANY of these are true:
- Usage dropped more than 40% month-over-month for 2+ consecutive months
- Zero logins in past 30 days
- NPS score under 5, or dropped 4+ points recently
- Champion departure confirmed
- 60 days to renewal with health score under 60
Medium risk if ANY of these are true:
- Usage dropped 20-40% month-over-month
- Fewer than 5 logins in past 30 days
- NPS between 5-6, or dropped 2-3 points
- 3 or more support tickets in past 30 days
- 90 days to renewal with health score between 60-75
These rules are completely transparent. Anyone on your team can understand exactly why a customer got flagged, which builds trust in the system.
Combining multiple signals improves accuracy dramatically. Single indicators generate too many false positives - lots of healthy customers have an off month. Combined signals are much more reliable.
For example, flag as high-risk ONLY if 2 or more of these are true: usage below threshold, engagement score low, support tickets elevated, and renewal within 90 days. This reduces false positives while maintaining sensitivity to genuine risk.
Trigger conditions determine when and how to act on the predictions. Immediate CSM alert for high-risk accounts over $50K ARR. Weekly digest for medium-risk accounts. Monthly review for low-risk accounts with emerging signals. Automatic intervention campaigns for tech-touch accounts.
Different risk levels warrant different responses. You can't treat every flag the same way.
Simplicity and transparency are actually strengths of rule-based models, not weaknesses. CSMs understand why customers are flagged. They can validate the logic themselves. They trust the alerts because they make intuitive sense.
Machine learning models might be more accurate, but they often feel like black boxes. Nobody knows why a customer got flagged, which makes CSMs skeptical. Rule-based models build trust precisely because they're interpretable.
Intercom started with a super simple rule: any customer with fewer than 10 sessions in 30 days and approaching renewal is at-risk. That's it. It caught 65% of eventual churns with basically zero false positives. The simplicity drove immediate adoption across the CS team.
Scoring Models: Weighted Factors for Nuanced Prediction
Scoring models add sophistication by weighting multiple factors according to their predictive power.
Component selection identifies the factors that actually matter in your business. You might weight product usage at 30%, engagement level at 20%, support health at 15%, relationship strength at 15%, financial health at 10%, and time to renewal at 10%.
These weights should reflect which factors historically correlate most strongly with churn in YOUR data, not someone else's.
Weighting methodology can come from intuition (expert judgment from CS leaders who've seen hundreds of churns), regression analysis (statistical analysis of historical churn patterns), or iterative testing (try different weights, measure accuracy, refine based on results).
Most companies start with intuition-based weights, then refine with data over time as they build up more churn history.
Score calculation combines weighted components into a single health score:
Here's an example customer:
- Product usage: 40 out of 100, weighted at 30% = 12 points
- Engagement: 60 out of 100, weighted at 20% = 12 points
- Support health: 70 out of 100, weighted at 15% = 10.5 points
- Relationship: 80 out of 100, weighted at 15% = 12 points
- Financial health: 90 out of 100, weighted at 10% = 9 points
- Time to renewal: 30 out of 100, weighted at 10% = 3 points
Total health score: 58.5 out of 100, which crosses into high-risk territory if your threshold is 60.
Threshold setting determines risk tiers. You might use 80-100 as healthy (green), 60-79 as at-risk (yellow), and under 60 as high-risk (red).
These thresholds should be calibrated to your historical churn data. If 80% of churned customers had scores below 60 in the preceding 90 days, that threshold makes sense. If only 40% did, you need to adjust.
Validation and tuning tests the model against historical data to see if it actually works. How many customers who churned were flagged as high-risk beforehand? How many flagged as high-risk didn't actually churn (false positives)? What's the lead time between risk flag and actual churn? Does the model work equally well across different customer segments?
Totango built a weighted scoring model and backtested it against 18 months of churn data. Initial accuracy was 71%, which isn't bad. After tuning weights and thresholds based on what they learned, they reached 82% accuracy with 75-day average lead time.
Machine Learning Approaches: Pattern Detection at Scale
For larger datasets, machine learning models can detect patterns that humans would never spot.
Algorithm selection depends on your data size, technical capabilities, and accuracy requirements:
Logistic regression is the simplest ML approach. It predicts probability of churn based on multiple variables, stays interpretable (shows which factors matter most), works well with smaller datasets (100+ churn events), and serves as a common starting point for ML-based churn prediction.
Decision trees and random forests create branching logic based on feature combinations. They handle non-linear relationships well and can reveal unexpected patterns (like "customers who do X AND Y but NOT Z have 10x churn risk"). They're more complex but more powerful than simple regression.
Neural networks detect complex patterns in large datasets. They require substantial data (1000+ churn events to train properly), offer less interpretability but potentially higher accuracy, and are usually overkill for most mid-sized SaaS companies.
Gradient boosting methods like XGBoost and LightGBM represent the state-of-the-art for structured data. They deliver high accuracy with reasonable interpretability, serve as the industry standard for serious churn prediction, but require real data science expertise to implement properly.
Training data requirements determine what's actually feasible for your company:
Minimum viable dataset includes 100+ historical churn events, 12+ months of customer data, and 20+ potential features (usage, engagement, support, etc.).
Optimal dataset includes 500+ churn events, 24+ months of data, 50+ engineered features, and multiple customer segments for proper validation.
If you don't have enough historical churn data, machine learning won't outperform simpler rule-based models. You need sufficient data to train on.
Feature engineering creates predictive variables that capture meaningful patterns:
Basic features include current usage level, NPS score, days to renewal, and support ticket count.
Engineered features get more sophisticated: usage trend (7-day vs 30-day average), engagement velocity (increasing vs declining over time), relative usage (compared to similar customers), feature adoption breadth, relationship tenure, and payment history patterns.
ProfitWell found that trend features (usage change rate) were 3x more predictive than point-in-time features (current usage level). How things are changing matters way more than the current state.
Model training follows a standard process:
Split historical data into training (70%), validation (15%), and test (15%) sets. Train the model on the training set. Tune hyperparameters using the validation set. Evaluate final performance on the test set (data the model has never seen). Then retrain on the full dataset once you've validated it works.
This prevents overfitting where your model memorizes the training data but performs poorly on new data.
Feature importance shows what actually drives the predictions, which tells you where to focus intervention efforts:
Example output might show usage trend (30-day change) at 28% importance, days to renewal at 18% importance, support ticket sentiment at 15% importance, engagement score decline at 12% importance, champion status at 10% importance, and other features combining for 17%.
This reveals which factors matter most in your specific business and where you should focus retention efforts.
Model Performance: Accuracy Metrics and Optimization
Models are only useful if they're accurate and actionable. Here's how to measure and improve performance.
Accuracy metrics measure different aspects of how well your model works:
Precision answers: Of customers flagged as at-risk, what percentage actually churned? High precision (80%+) means few false alarms. Low precision (40%) means CSMs waste tons of time on customers who won't churn.
Recall answers: Of customers who churned, what percentage did we flag as at-risk beforehand? High recall (85%+) means we catch most churns before they happen. Low recall (50%) means half our churns come as complete surprises.
F1 score balances precision and recall using their harmonic mean. It prevents gaming the system by optimizing only one metric. Good models achieve F1 scores above 0.75.
True vs false positives involve a trade-off that requires business judgment:
False positives (flagged as at-risk but didn't churn) cost you wasted CSM time on unnecessary interventions. But there's a benefit too - proactive engagement might prevent churn that would have happened without the intervention.
False negatives (churned but weren't flagged) cost you a missed opportunity to save a customer. You lose revenue and never even attempt an intervention.
Most companies optimize for high recall (catch churns) even if it means more false positives. Missing a $100K churn hurts way more than spending an extra hour on a customer who wasn't really at risk.
Optimization trade-offs require tuning for your specific business economics:
For high-value accounts, optimize for recall. You want to catch every possible churn, even if you get false positives. The cost of missing one is too high.
For low-value accounts, optimize for precision. You can't afford to waste CSM time on false alarms when the account value doesn't justify the intervention cost.
You might run two completely different models with different thresholds for different customer segments.
A/B testing validates whether model improvements actually work in practice:
Control group gets alerts from your current model. Test group gets alerts from a new model you're evaluating. Measure churn rates, save success rates, and CSM effort required across both groups.
If the new model reduces churn in the test group without requiring dramatically more CSM time, roll it out broadly. If it doesn't, figure out why before making changes.
Continuous improvement keeps models accurate as your business evolves:
Monthly reviews should examine flagged accounts that didn't churn (false positives - why were they flagged?) and churns that weren't flagged (false negatives - what signals did we miss?).
Quarterly activities include retraining the model with new data, testing new features and indicators, and adjusting thresholds if patterns have shifted.
Annual activities involve comprehensive model rebuilds and evaluating whether to upgrade to more sophisticated approaches.
Churn patterns change over time as your product evolves, your customer base matures, and market conditions shift. Your model must evolve with them.
Operationalizing Predictions: From Scores to Action
Models only create value when they actually drive interventions. Here's how to turn predictions into saved accounts.
Integration with workflows embeds predictions in daily operations where people work:
CRM integration puts a health score field visible on every customer record. At-risk flags trigger automated workflows. Risk level determines CSM assignment and priority automatically.
Dashboard visibility gives CSM dashboards showing at-risk accounts sorted by ARR. Weekly risk reports go to CS leadership. Trending risk indicators show accounts moving from green to yellow to red so you can spot deteriorating situations early.
Alert generation notifies the right people at the right time:
Tiered alerts might include immediate CSM notification plus manager escalation for high-risk, high-value accounts (over $50K ARR). High-risk, mid-value accounts ($10K-$50K) go in CSM daily digests. Medium-risk accounts get weekly review lists. Low-risk accounts with emerging signals get monthly monitoring.
Alert fatigue is real. Send too many alerts and CSMs ignore all of them. Segment by priority so critical alerts actually get attention.
CSM dashboards provide actionable views that make prioritization trivial:
A good "My at-risk accounts" dashboard shows accounts sorted by ARR (highest value first), risk score and trend (improving vs declining), key factors driving risk (usage down, support issues, renewal soon), last touchpoint date, and suggested next action.
This makes it dead simple for CSMs to prioritize their day - start with highest-value, highest-risk accounts where you can make the biggest impact.
Intervention triggering automates appropriate responses:
Automated plays might include: medium-risk account gets an email with best practices and usage tips, high-risk account triggers a scheduled CSM outreach call, champion departure detected launches a multi-threading relationship campaign, usage drop detected triggers a re-onboarding sequence.
Automation ensures consistent response even when CSMs are completely overwhelmed or someone's on vacation.
Tracking outcomes measures whether interventions actually work:
For each at-risk account, track the risk score when initially flagged, interventions attempted, customer response to interventions, final outcome (retained, churned, or even expanded), and days from flag to resolution.
This data feeds back into model improvement. If customers flagged for "low engagement" consistently respond well to webinar invitations, you've learned an effective intervention tactic.
Model refinement based on real outcomes asks critical questions:
Which risk factors responded to intervention? Which factors were basically unpreventable? What lead time is optimal (too early means false positives, too late means you can't save them)? Do different customer segments need completely different models?
Zendesk discovered that SMB customers needed 90-day lead time but enterprise customers only needed 45 days. They built segment-specific models with different thresholds, improving overall accuracy by 15% compared to the one-size-fits-all approach.
Ready to build churn prediction that drives retention? Learn how to implement customer health monitoring systems, build early warning systems, develop save strategies for at-risk accounts, and establish churn analysis processes that continuously improve your models.
Related resources:

Senior Operations & Growth Strategist
On this page
- Prediction Model Goals: What Good Models Achieve
- Predictive Indicators: Signals That Forecast Churn
- Rule-Based Models: Simple Thresholds That Work
- Scoring Models: Weighted Factors for Nuanced Prediction
- Machine Learning Approaches: Pattern Detection at Scale
- Model Performance: Accuracy Metrics and Optimization
- Operationalizing Predictions: From Scores to Action