More in
職場における AI インサイト
コーディネーション・タックス(調整コスト税): 業務遂行スピードを損なう隠れたコスト
4月 13, 2026 · Currently reading
AI の ROI をどう測定するか:実践的フレームワーク
3月 17, 2026
職場における AI ガバナンスの空白
3月 5, 2026
AI エージェントがセールスパイプラインをどう変えるか
1月 22, 2026
AI コパイロット vs AI エージェント:違いと使い分け
1月 21, 2026
コーディネーション・タックス(調整コスト税): 業務遂行スピードを損なう隠れたコスト
Turn this article into takeaways for your work.
Each assistant summarizes the article only for you and suggests best practices for your work.
多くのOpsチームは、ヘッドカウント、ツール費用、プロジェクトの進捗速度を把握しています。しかし、調整コスト、つまりチームが「業務そのもの」ではなく「業務の調整」に費やす週あたりの時間を把握しているチームはほぼ皆無です。
このギャップはコストを生み出します。そして、対処する方法はあります。しかし、計測できないものは改善できませんし、名前のないものは計測できません。
この記事では、それに名前をつけるためのフレームワークを紹介します。それが「コーディネーション・タックス(調整コスト税)」です。これは、チームの総労働時間のうち、ステータス更新、引き継ぎ、コンテキストスイッチング、会議のオーバーヘッド、情報検索といった調整活動に費やされる割合を指します。これらはすべて、本来その活動が生み出すべきアウトプットに直接結びついているものではありません。ほとんどのチームは、その税率を知らないままこのコストを支払っています。実際に計算したチームは、多くの場合その数字に驚かされます。
コーディネーション・タックスとは何か
コーディネーション・タックスは、個々のタスクの非効率性に関するものではありません。チームがお互いに情報を共有し、足並みをそろえ、作業が滞らないようにするために積み重なる構造的なオーバーヘッドの問題です。協働作業には本質的に一定の調整が必要です。問題は、その調整のどれだけが必要不可欠で、どれだけが情報アーキテクチャの機能不全のサインであるかという点です。
以下が実用的な定義です。
コーディネーション・タックス(調整コスト税): 直接的なアウトプットを生み出すためではなく、関係者間の同期、コンテキストの共有、または情報の取得を主な目的とする活動に費やされる、総報酬労働時間に対する割合。
考え方として役立つのは次の問いです。ある週の調整活動をすべて取り除いても、情報と意思統一がすでに整っていてチームが問題なく実行できるなら、それらの活動は純粋なコストでした。取り除いたら実行が失敗するなら、それらの一部は必要なインフラです。目標は調整をゼロにすることではありません。必要な調整と余剰なオーバーヘッドを区別し、オーバーヘッドを削減することです。
研究の結果は明確です。Microsoftの2023年版Work Trend Indexによると、従業員は57%の時間をコミュニケーションと調整に費やしており、集中した創造・実行作業に充てる時間が圧迫されています。McKinseyのknowledge worker生産性に関する調査では、異なる角度から同様の傾向が示されています。knowledge workerは週の約28%をメール管理に、さらに14%を社内コミュニケーションと協働に費やしていると推定されています。つまり40時間の週のうち、42%が調整に費やされた後で、ようやく最初のアウトプット単位が生まれるということです。
しかし、集計統計はチームレベルの現実を覆い隠します。コーディネーション・タックスは、チーム構造、役割の種類、ツール環境、マネジメント文化によって大きく異なります。週1回の同期と明確なasyncドキュメントを持つ5人チームであれば、コーディネーション・タックスは20%程度かもしれません。ツールが分散し、定例会議が4つあり、同時間内の返信が期待される12人チームでは60%に達することもあります。
調整コストの5種類
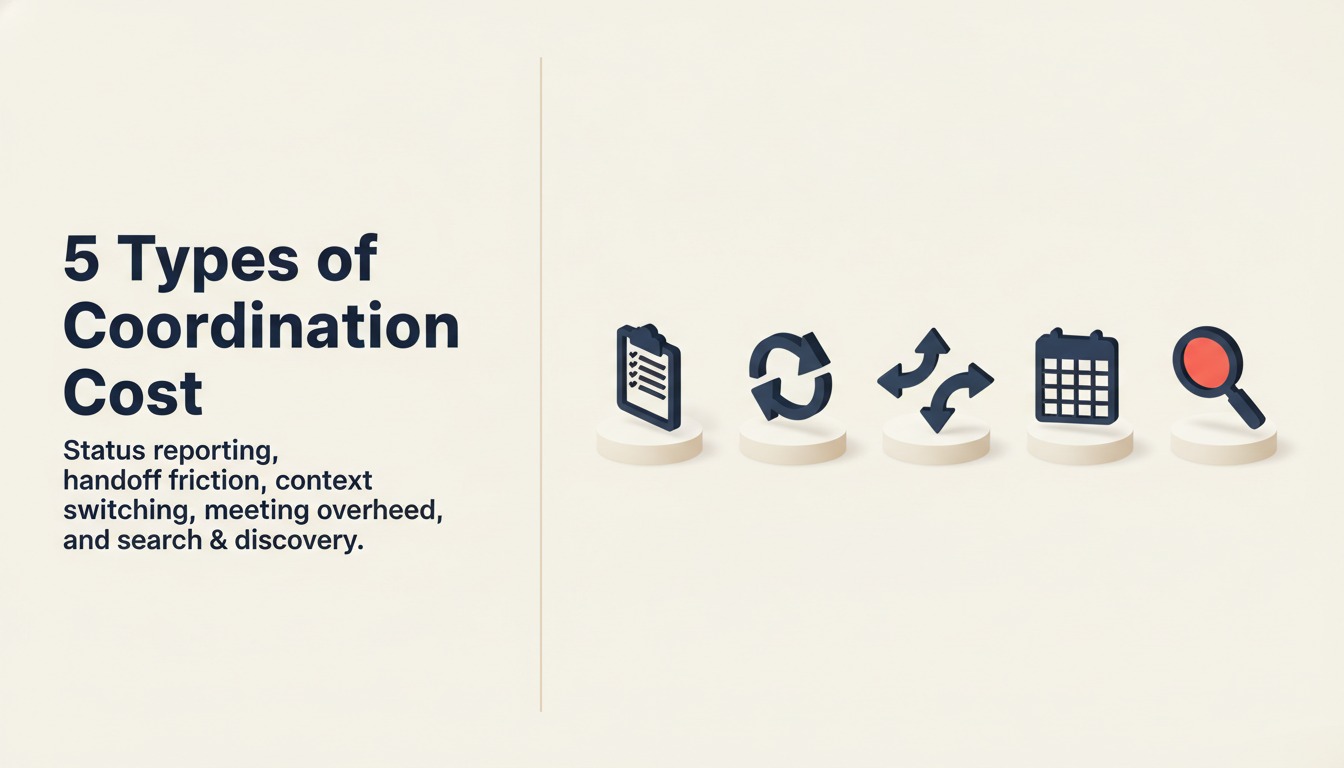
コーディネーション・タックスは、5つの異なるコストカテゴリに分解できます。それぞれに異なる根本原因、異なる計測アプローチ、そして異なる解決策があります。
1. ステータス報告のオーバーヘッド
これは最も目に見えやすいカテゴリです。すでに起きたことについての報告を作成・閲覧・議論するために費やされる時間です。週次ステータスメール、ブロッカー議論ではなく状況確認になってしまったstandup、金曜の振り返りSlackメッセージ、チャットで転送されるdashboardのスクリーンショットがその典型例です。
コストは報告書を作成する時間だけではありません。受け取る全員が費やす時間に加え、ステータスが継続的・自動的ではなく、断続的・定期的であることで生じるレイテンシも含まれます。ステークホルダーがプロジェクトの状況を把握する唯一の手段が「確認を求めること」であり、その確認に誰かが手を止めて答える必要があるなら、業務モデルの中に調整のボトルネックを組み込んでしまっていることになります。
部門横断的なチームでは、各部門が独自の報告サイクルを持つため、ステータス報告のオーバーヘッドは複利で積み上がります。マーケティング、プロダクト、Opsのステークホルダーがいる営業プロジェクトでは、プロジェクトリードが同じ内容を3つの異なるフォーマットで説明しなければならない3つの報告サイクルが発生することもあります。
2. 引き継ぎの摩擦
引き継ぎの摩擦は、業務が手から手へと移るたびに生じるコストです。マーケティングから営業へ、営業からカスタマーサクセスへ、デザインからエンジニアリングへ、チームAのsprintアウトプットからチームBの次のsprintインプットへ、といった流れが該当します。
きれいな引き継ぎは、受け取る側が確認の質問をせずに実行するために必要なコンテキスト全体を伝えます。コストの高い引き継ぎは、成果物(ドキュメント、チケット、完了タスク)だけを渡し、受け取る側がコンテキストを再構築したり、不足している情報を収集したり、不完全な情報で安全に実行できる範囲にスコープを絞らざるを得なくなります。
ここでのコストは時間だけではありません。失敗または質の低い引き継ぎは、手直し、要件の見落とし、チーム間の関係上の摩擦も生み出します。これらはすべて、最初の調整イベントをはるかに超えて積み重なるコストを伴います。
3. コンテキストスイッチングのコスト
コンテキストスイッチングとは、タスク、ツール、または思考モデルを切り替える際の認知的コストです。これに関する研究結果は一貫しており、重要な示唆を持っています。UC IrvineのGloria Mark氏の研究では、中断後に完全に集中状態を取り戻すまでに平均23分かかることが示されています。1時間に3回の中断があれば、knowledge workerは終日ほぼ深い集中ができない状態で働いていることになります。
しかし、業務遂行スピードに現れるコンテキストスイッチングは、単なる中断だけの問題ではありません。ツールの分散化も大きな要因です。1つのタスクを完了するために必要な情報が5つの異なるシステムに分散していると、すべてのタスクにタブ切り替え・検索・相互参照のオーバーヘッドが伴います。商談情報を更新し、メールスレッドを確認し、提案書を見直し、価格条件を調べ、コールノートを記録しなければならない営業担当者は、実質的に1つのタスクを完了するために6つもの異なるインターフェースを操作することになります。
この切り替えは生産性の指標には現れません。プロジェクト管理システムにも記録されません。しかし、一人ひとりの毎週の時間数として積み重なっていきます。
4. 会議のオーバーヘッド
会議のコストは、カレンダー上に見えている部分だけではありません。直接コストは会議中の時間です。間接コストは、準備時間、会議後のコンテキスト回復時間、そして意思決定に会議が必要とされることで生じる意思決定のレイテンシです。
8名参加の1時間会議は、最低でも8人分の時間、すなわち8人時のコストです。各参加者が20分の準備と15分のコンテキスト回復に費やしたとすれば、実際のコストは約14人時に近づきます。この会議が毎週繰り返されるなら、1つの会議だけで年間700人時以上に達します。Harvard Business Reviewの会議過多に関する研究も、これが協働の不可避なコストではなく、解決可能な構造的問題であることを確認しています。
より重要な問いは、会議の量ではありません。会議が何の代わりになっているかです。情報が自動的に流通しないために存在する会議は、コーディネーション・タックスです。複雑な意思決定にリアルタイムの議論が必要なために存在する会議は、必要なインフラです。この区別がきちんと検討されることはほとんどありません。
5. 検索・発見コスト
これは最も過小評価されているカテゴリです。適切なドキュメント、適切なバージョン、適切な担当者、または適切な答えを見つけるために費やされる時間のことです。最新の価格資料はどこにありますか?現在有効な契約テンプレートはどれですか?エンタープライズ契約の更新プロセスを誰が担当していますか?このベンダーについて以前に競合分析を行ったことがありますか?
「Slackで検索してください」が答えなら、実際のコストは5〜15分の検索に加え、見つかった結果が最新で、信頼できるものかどうかという不確実性も含まれます。「誰かに聞いてください」が答えなら、問い合わせる側の時間に加え、回答者の中断コストと回答を待つレイテンシが発生します。
検索コストはチーム規模とツール数に対して非線形に増大します。3つのツールを使う10名チームであれば、情報アーキテクチャの問題は管理可能です。15の統合ツールと5年分のSlack履歴を持つ200名の組織では、社員一人当たり毎週数時間に及ぶ慢性的・複利的な検索コストが発生している可能性が高いです。
コーディネーション・タックスの計測方法
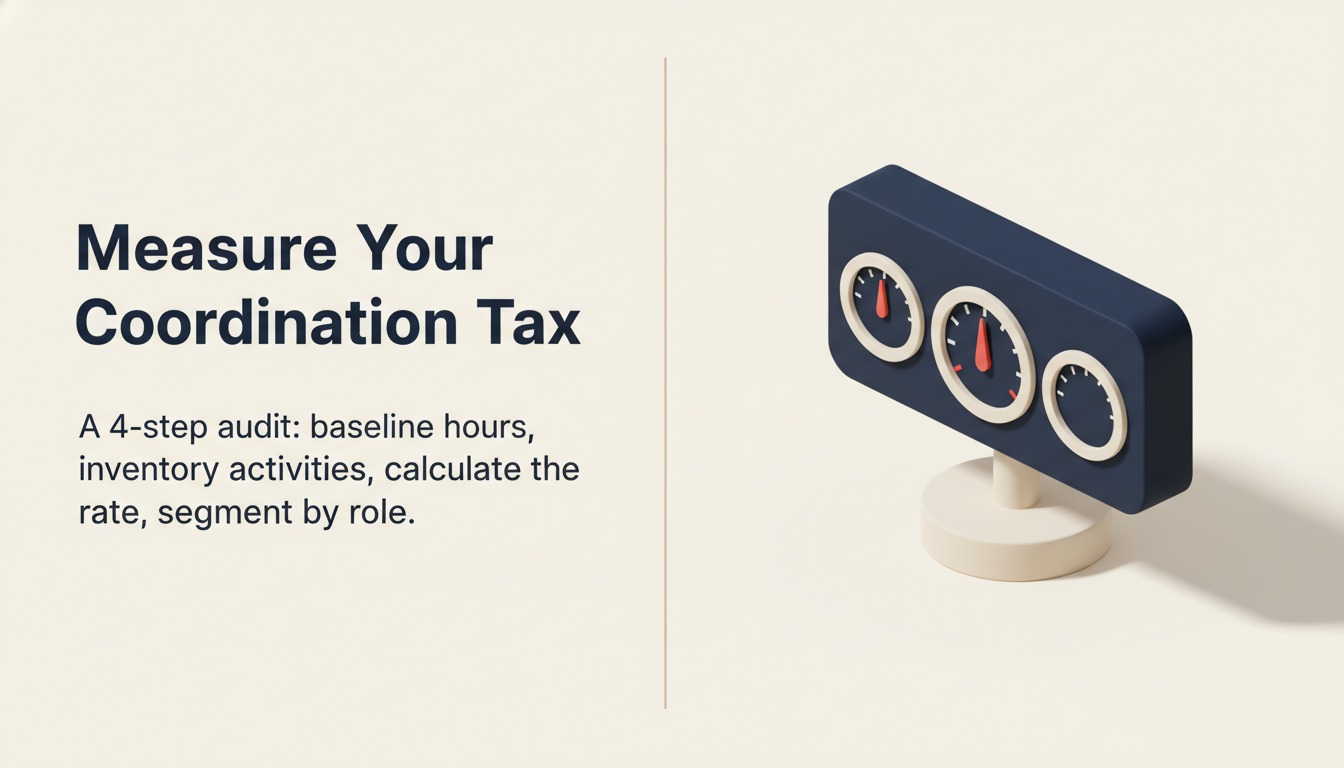
コーディネーション・タックスを算出するには3つのインプットが必要です。労働時間のベースライン、調整活動のインベントリ、そして分類作業です。完全な方法論には1週間かかりますが、合理的な近似値であれば2時間で算出できます。
ステップ1: 労働時間のベースラインを確立する
| インプット | 算出方法 |
|---|---|
| チーム規模 | ヘッドカウント(FTE換算)を数える |
| 一人あたりの週間労働時間 | 契約時間を使用(通常40時間) |
| チームの週間総労働時間 | チーム規模 × 週間労働時間 |
| 推定集中作業時間(管理値) | アンケート:「実際に週何時間の深い集中作業を行っていますか?」 |
ステップ2: 調整活動のインベントリを作成する
チームの各メンバーについて、各カテゴリに費やした週間時間数を数えます。最も速い方法は、シンプルな5行のトラッキングシートを使った1週間の時間監査です。合理的なショートカットは、各カテゴリを順に確認して見積もりを聞く15分間の構造化インタビューです。
| 調整カテゴリ | 週あたり時間数の見積もり | 労働週に占める割合 |
|---|---|---|
| ステータス報告(作成・閲覧) | __ | __ |
| 引き継ぎ活動(引き継ぎ準備、フォローアップ) | __ | __ |
| コンテキストスイッチングのオーバーヘッド(回復時間の見積もり) | __ | __ |
| 会議のオーバーヘッド(会議、準備、コンテキスト回復) | __ | __ |
| 検索・発見(ドキュメント、担当者、答えの探索) | __ | __ |
| 調整時間合計 | __ | __ |
ステップ3: 税率を算出する
コーディネーション・タックス率 = 調整時間合計 / 総労働時間 × 100
例: 8名チームで、各自が週40時間(合計320時間)働いており、調整活動のインベントリが週計144時間であれば、コーディネーション・タックス率は45%となります。
ステップ4: 役割の種類別にセグメント化する
コーディネーション・タックスは役割によって大きく異なります。実行重視の個人貢献者(IC)は、マネージャー、部門横断的なリード、または調整促進を専任とするOps担当者と比べて、一般的に低い税率になります。結論を出す前にセグメント別に算出してください。
| 役割の種類 | コーディネーション・タックスの想定範囲 |
|---|---|
| 実行重視のIC(開発者、デザイナー、ライター) | 15〜30% |
| 顧客対応IC(AE、CSM、SDR) | 25〜40% |
| Ops担当(Ops、RevOps、財務、EA) | 35〜55% |
| マネージャーおよびチームリード | 40〜60% |
| DirectorおよびVP | 50〜70% |
| 部門横断的なプロジェクトリード | 45〜65% |
ベンチマーク: 優れた状態の基準
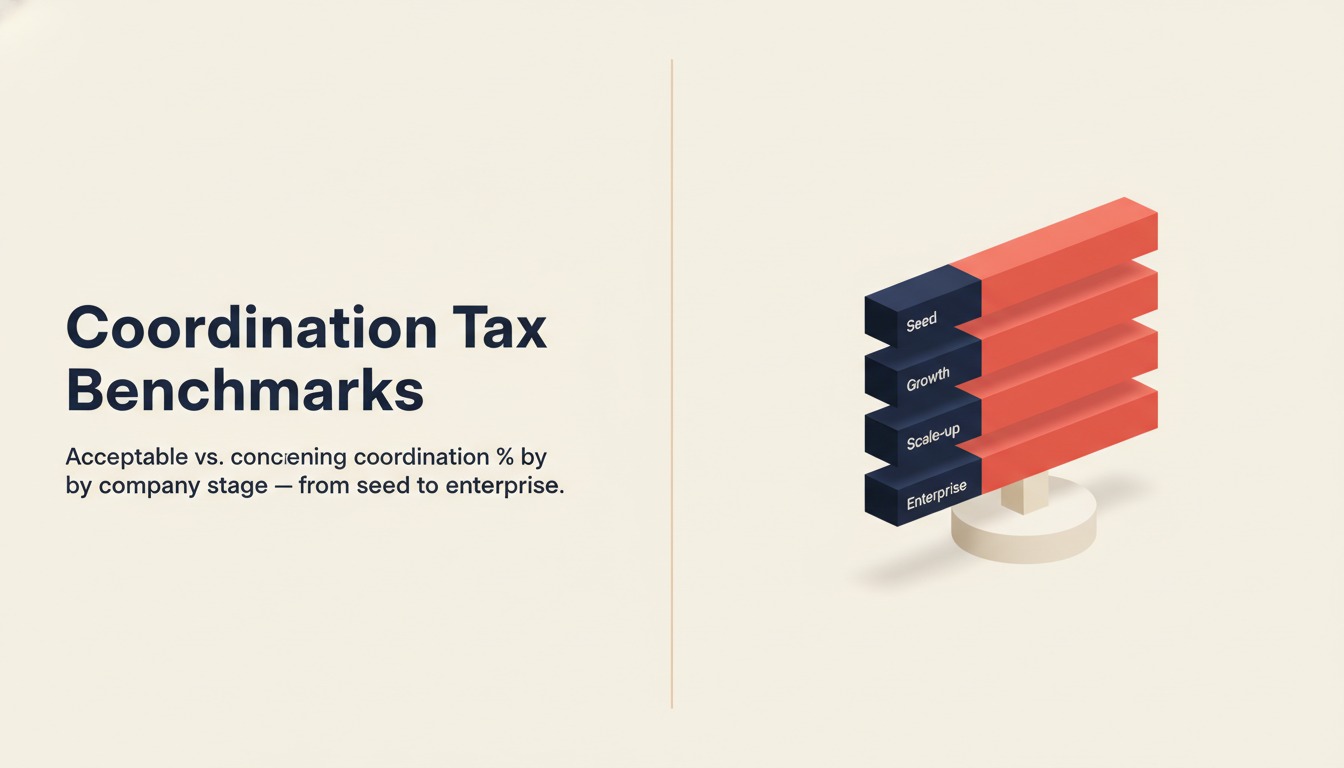
適切なコーディネーション・タックス率は、組織の構造、役割の構成、および成長段階によって異なります。ただし、以下のベンチマークは自社の数値を評価するための参照軸を提供します。
| 企業ステージ | チーム規模 | 許容できるコーディネーション・タックス | 懸念される閾値 |
|---|---|---|---|
| 初期ステージ(シード) | 5〜15名 | 20〜30% | 40%超 |
| 成長ステージ | 15〜75名 | 25〜35% | 50%超 |
| スケールアップ | 75〜300名 | 30〜40% | 55%超 |
| エンタープライズ | 300名以上 | 35〜45% | 60%超 |
| M&A直後(統合期) | 規模を問わず | 40〜55%(一時的) | 65%超 |
この表を読む際のポイントをいくつか補足します。
組織変更、新ツールの展開、またはチームの急速な拡大の時期には、高い税率が想定されます。問いは、税率が高いかどうかではありません。高くなる理由があり、正しい方向に向かっているかどうかです。
「懸念される閾値」はクライシスの数値ではありません。コーディネーション・タックスが生産能力を単に消費するだけでなく、実際に制約している可能性が高い水準です。懸念閾値を超えているチームは、全員が忙しいにもかかわらず何事も迅速に進まないという感覚、低いモラル、会議疲れを報告することが多いです。
コーディネーション・タックスをゼロにすることは目標ではありませんし、達成不可能でもあります。一部の調整は真の価値創造です。コストのかかるミスを防ぐための意思統一、より良い意思決定を可能にするコンテキスト共有、チームの結束を維持するコミュニケーションがその例です。目標は、構造的なオーバーヘッドではなく、必要な調整を反映した税率を実現することです。
ツール不要の3つの構造的解決策
コーディネーション・タックス削減のアドバイスの多くは、ツールの推薦に終始します。より良いプロジェクト管理プラットフォームの導入。AIミーティングアシスタントの展開。ドキュメント管理システムの実装。これらは役に立つこともありますが、ツールは構造的な問題を解決しません。構造が行動を生み出す条件を変えます。ツールは構造の中で情報を自動化・可視化します。構造が壊れていれば、ツールは壊れた構造を高速化するだけです。
新たな導入なしでコーディネーション・タックスを削減できる3つの構造的な介入を紹介します。
解決策1: ステータス会議を廃止し、自動asyncアップデートに置き換える
ステータス会議は、ほとんどの組織において最もコストの高い調整活動です。カレンダー上の時間、準備のオーバーヘッド、そして暗黙のメッセージにおいてコストが高いのです。その暗黙のメッセージとは、ステータスとはシステムが提示するものではなく、人が報告するものだということです。
構造的な代替手段は、asyncの自動ステータスです。これには3つの決断が必要です。(1)各プロジェクトタイプで完全なステータスアップデートを構成する要素を合意する、(2)そのアップデートをどこに置くかを決める(プロジェクトカード、共有ドキュメント、定期的なLoom動画)、(3)アップデートが質問への回答としてではなく、一定のサイクルで行われるという期待を確立する。
asyncアップデートには情報の所在について規律が必要なため、移行は快適ではありません。しかし、コーディネーション・タックスの削減は即座で計測可能です。定例のステータス会議を1つ廃止してasyncアップデートに置き換えたチームは、一人当たり週2〜4時間を取り戻すことが多いです。
重要な行動の転換点は、ステータスが「説明するもの」から「文書化するもの」に変わることです。
解決策2: 引き継ぎの品質ではなく、引き継ぎポイントの数を減らす
引き継ぎの摩擦のほとんどは、個々の引き継ぎの品質ではなく、引き継ぎポイントの数から生じます。4チームにまたがる7ステップのプロセスは、各引き継ぎがいかにうまく実行されても、各移行ポイントで調整コストを積み上げます。
構造的な解決策は、引き継ぎポイント数を削減するプロセス再設計です。これは多くの場合、特定の業務種類の所有範囲を拡大することを意味します。つまり、1つのセグメントを実行して次に渡すのではなく、1つの役割またはチームがワークフローを最初から最後まで所有するようにします。時には、組織がすでに乗り越えたリスクレベルを想定して設計された中間レビューステップをなくすことも意味します。
シンプルな診断方法があります。最もボリュームの多い定期プロセスのすべての引き継ぎをマッピングしてください。それぞれについて問いかけます。この引き継ぎをなくし、前チームのスコープを次のステップまで拡大したら何が壊れるか。その答えが真の能力ギャップやリスクコントロールに関わらないものであれば、廃止の候補です。
引き継ぎポイントを減らすことは、引き継ぎの品質を改善するより組織的に難しいです。役割のスコープの再交渉、場合によってはチーム構造の変更が必要です。しかし、コーディネーション・タックスの削減効果は大幅に大きく、より持続的です。
解決策3: best-of-breed スタックよりsingle source of truth を優先する
ツールの分散化問題は、ツールを追加することでは解決できません。しかし、各カテゴリの情報がどこに格納されるかについて明示的な選択を行い、その選択を徹底することで軽減できます。
ここでの構造的な介入は「すべてを1つのツールに統合する」ことではありません。「各情報カテゴリの信頼できるソースを定義し、そのソースをデフォルトの最初の参照先にする」ことです。顧客データはCRM。プロジェクトのステータスはプロジェクト管理システム。承認済みテンプレートはドキュメント管理システム。これらの指定が明確で、チームの規範として徹底されている場合、最初に見る場所が正しい場所になるため、検索・発見コストが下がります。
「best-of-breed スタック」のデフォルト(各機能に最適なツールを選び統合する)は、情報の一貫性を犠牲にして機能品質を最大化します。仕事に必要な情報が8〜12のシステムに分散し、それぞれを個別に検索しなければならなくなります。その断片化をナビゲートするための調整コストは、さらにもう一つのベストインクラスツールを追加する際のROI計算にほとんど含まれません。
ツールが効果を発揮する場合と発揮しない場合
ツールがコーディネーション・タックスを削減するのは、明確に定義された構造の中で、現在手動で行われている調整活動を自動化する場合です。構造そのものが問題である場合には効果がありません。
最も明確な区別を以下に示します。
| シナリオ | ツールの追加は有効か? |
|---|---|
| ステータスアップデートが手動で不安定 | 有効。自動化により人の手を介さずステータスを可視化できる |
| ステータスアップデートは存在するが誰も読まない | 無効。問題はツールではなく信頼と文化 |
| コンテキストが共有されないために引き継ぎが失敗する | 一部有効。テンプレートとチェックリストは役立つが、根本原因はプロセス設計にあることが多い |
| 情報が分散しているため検索コストが高い | 有効。情報の統合と検索ツールが役立つ(正規ソースの徹底も必要) |
| 意思決定にリアルタイムの議論が必要なため会議が多い | 無効。問題は意思決定の構造であり、ツールではない |
| ツールの分散によりコンテキストスイッチングが多い | 有効。統合により切り替えコストが削減できる |
| 中断文化により高頻度なコンテキストスイッチングが発生 | 無効。問題は規範と期待値であり、ツールではない |
コーディネーション・タックス削減プログラムで最も多い失敗は、構造的な問題を診断してツールを処方することです。2番目に多いのは、ツールの問題を診断してプロセス変更を処方することです。的確な診断は介入そのものより重要です。誤った解決策は、コストを削減するのではなくオーバーヘッドを増やすことになるからです。
まず計測から始める
コーディネーション・タックスのフレームワークはプロジェクトではありません。計測の習慣です。最初の算出を行ったら、90日後に再度実施してください。税率を時系列で追跡してください。コンポーネントに分解してください。どのカテゴリが最も高く、どれが変化しており、チームの特定の構造において最もレバレッジが効くのかを問い続けてください。
ほとんどの組織が調整コストを削減できていない理由は、優れたツールや優秀な人材が不足しているからではありません。単に計測したことがないからです。追跡できないものは管理できませんし、名前のついていないものは追跡できません。
ほとんどのOpsチームは、ヘッドカウント、ツール費用、プロジェクトの進捗速度を把握しています。今後3年間で競合他社より先に進むチームは、毎週の労働時間のうち業務の調整に失われている割合も追跡しているチームです。名前をつけてください。計測してください。その先に削減があります。
さらに詳しく学ぶ

Co-Founder, Rework.com
On this page
- コーディネーション・タックスとは何か
- 調整コストの5種類
- 1. ステータス報告のオーバーヘッド
- 2. 引き継ぎの摩擦
- 3. コンテキストスイッチングのコスト
- 4. 会議のオーバーヘッド
- 5. 検索・発見コスト
- コーディネーション・タックスの計測方法
- ステップ1: 労働時間のベースラインを確立する
- ステップ2: 調整活動のインベントリを作成する
- ステップ3: 税率を算出する
- ステップ4: 役割の種類別にセグメント化する
- ベンチマーク: 優れた状態の基準
- ツール不要の3つの構造的解決策
- 解決策1: ステータス会議を廃止し、自動asyncアップデートに置き換える
- 解決策2: 引き継ぎの品質ではなく、引き継ぎポイントの数を減らす
- 解決策3: best-of-breed スタックよりsingle source of truth を優先する
- ツールが効果を発揮する場合と発揮しない場合
- まず計測から始める
- さらに詳しく学ぶ